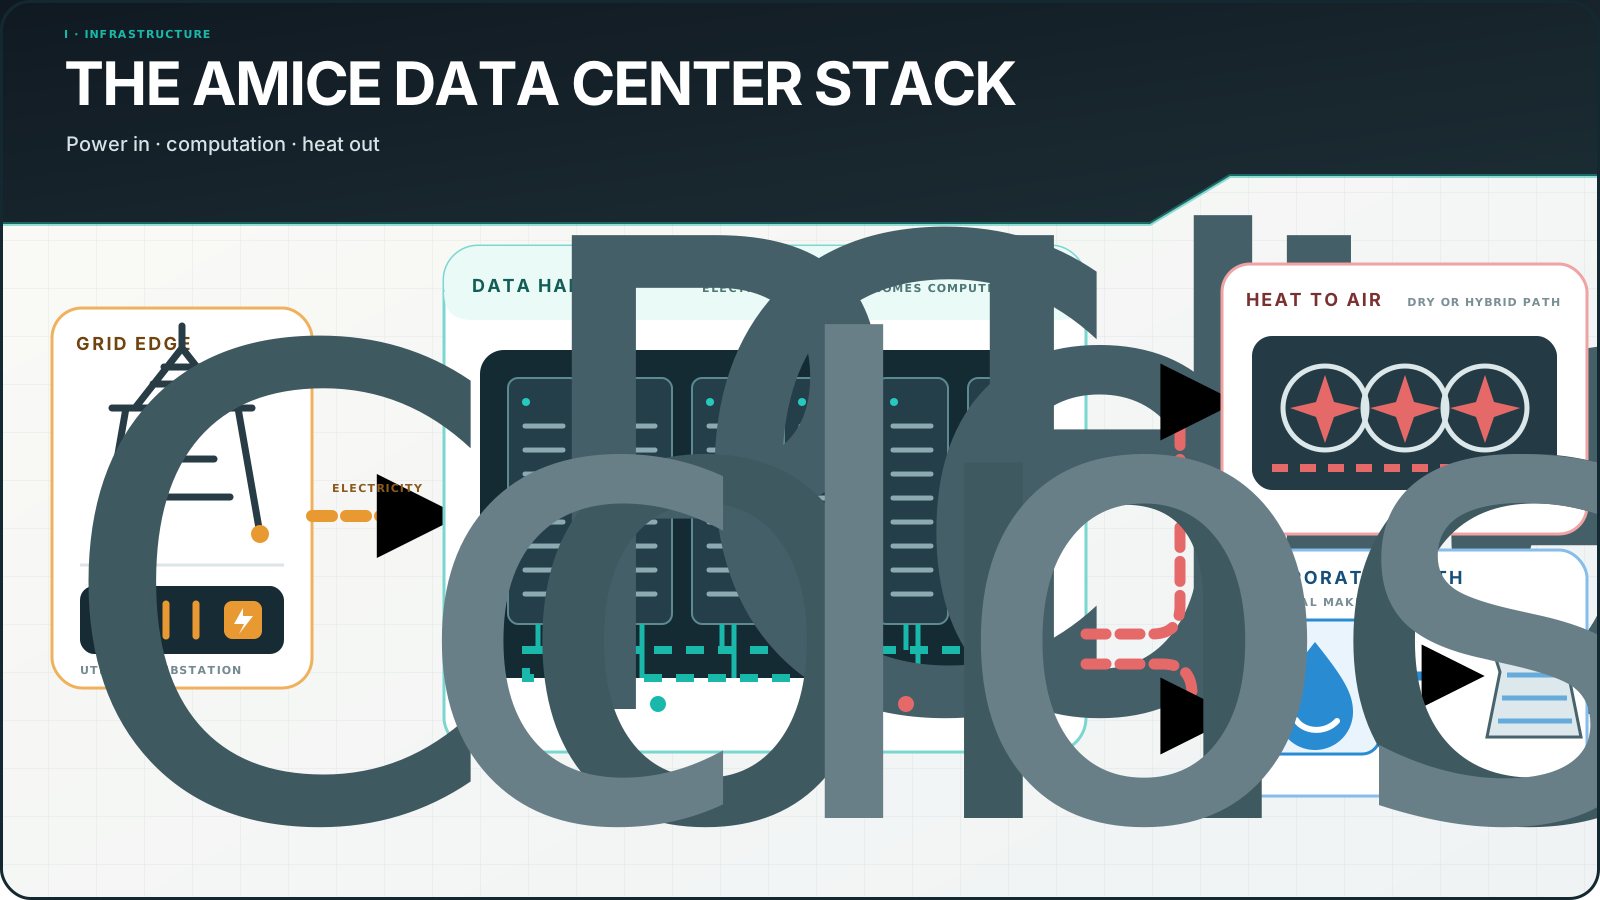
Walk a watt from the grid to the chip and back out as heat, explore U.S. data-center geography, compare cooling and water systems, hear the sources of community noise, and investigate what public records still cannot tell us.
An AI data center has to deliver electricity to chips and carry their heat away every second it runs. Follow those two journeys to understand its size, cooling, water use, and effect on its neighbors.
This cutaway illustrates a possible layout. Colored lines organize the illustration; they are not traced electricity, water, or fiber. Actual equipment, ownership, workload, heat rejection, and water paths remain facility-level facts to verify.
Tap an AI app and the answer appears weightless. Somewhere else, electricity crosses a substation, thousands of chips switch, pumps and fans move almost all of that electrical energy away as heat, and a utility, water authority, grid operator, landowner, developer, cloud, model company, and local government each hold a different piece of the story.
This is the Infrastructure layer of the AMICE stack: Applications, Models, Infrastructure, Chips, and Energy. The primer and OpenStreetMap census retain their August 13, 2026 cutoff; the curated campus atlas includes September updates. The prose and further reading were reviewed on September 17, 2026. The downloads preserve their dataset-specific cutoffs, and each claim keeps its date, geography, denominator, status, and evidence type.
A map marker is not necessarily a facility. A campus plan is not operating load. A utility interconnection ceiling is not IT capacity. A company fleet total is not an AI workload allocation. "Liquid cooled" does not tell us whether the site evaporates water. "Powered by" does not tell us which generator served a particular hour.
Documented cloud regions and serving constraints
The September 18 documentation review adds named cloud regions, GPU availability, residency rules, and processing boundaries. Selecting a region shows records about that place. The optional time-zone suggestion is a starting point for research; a nearby campus does not establish where an application sends a request.
Documented hardware and regions
204 additional sources reviewed September 18, 2026. Each record names the workload or geography it supports. Training records describe training; availability and development plans have their own labels.
Your location can suggest a region to research. Endpoint configuration, residency rules, capacity, and cross-region routing determine where a request can run. Nearby data centers are not evidence of your application's serving location.
70 of 204 sources · showing 1-20
Research documentation
Documented AI hardware, training, cloud regions, and regional electricity
CoreWeave distinguishes shared-access and customer-reserved availability zones. Kubernetes clusters occupy one availability zone, and the instance matrix documents hardware deployed in each zone.
Listed hardware does not establish available capacity or identify a customer workload.
Global
documented
Publication date unavailable Reviewed 2026-09-18 primary
CoreWeave documents western US zones, including general-access GPU locations in Nevada, Arizona and Washington. Their offerings span A100, H100, H200 and Blackwell systems.
A state or GPU match does not establish where an application is served.
United States · Nevada · Arizona · Oregon · Washington · Colorado · California
documented
Publication date unavailable Reviewed 2026-09-18 primary
Bedrock geographic inference profiles constrain processing to their defined geography. AWS illustrates Claude Sonnet 4.5 routing among Northern Virginia, Ohio and Oregon within the US profile.
The source region and destination region can differ; the profile does not select the nearest data center.
United States · European Union · Asia Pacific
documented
Publication date unavailable Reviewed 2026-09-18 primary
Bedrock global cross-region inference can route Claude requests across supported commercial AWS regions worldwide, while monitoring records remain in the source region.
A regional API hostname or log location does not establish where inference ran.
Global
documented
Publication date unavailable Reviewed 2026-09-18 primary
Bedrock documents source and destination regions separately. GetInferenceProfile returns model ARNs from which operators can identify a profile's candidate destination regions.
Candidate destinations are not a record of the region selected for one request.
United States · Ireland · Japan · Global
documented
Publication date unavailable Reviewed 2026-09-18 primary
AWS publishes separate regional Bedrock control-plane and runtime endpoints, with named locations and service quotas. Runtime endpoints are used for model inference.
An endpoint region is insufficient to locate requests using cross-region inference.
Global
documented
Publication date unavailable Reviewed 2026-09-18 primary
Bedrock CloudTrail documentation identifies recorded API operations and event fields, giving operators an audit path beyond public provider disclosures.
Some data events require explicit logging; the page is not public telemetry for another customer.
Global
documented
Publication date unavailable Reviewed 2026-09-18 primary
The Bedrock GetInferenceProfile API returns a profile's models, status and type, supporting an account-specific check of eligible inference destinations.
The response describes routing configuration, not the destination of a completed inference request.
Global
documented
Publication date unavailable Reviewed 2026-09-18 primary
AWS publishes a feature-by-region matrix for AgentCore runtime, memory, gateway, identity and other agent infrastructure. Feature support varies within the same service.
The region hosting an agent runtime does not necessarily host its model inference.
United States · Germany · Ireland · United Kingdom · France · Spain · Sweden · India · Japan · Australia · Singapore · Canada · Brazil
documented
Publication date unavailable Reviewed 2026-09-18 primary
Bedrock's model matrix distinguishes in-region, geographic and global inference availability. It covers models from Anthropic, Amazon, DeepSeek, Google and other providers.
Model and deployment mode must both match; a model name alone does not identify a serving region.
Global
documented
Publication date unavailable Reviewed 2026-09-18 primary
Google publishes model endpoint availability and distinguishes global, regional and jurisdictional options. Its documentation warns an endpoint alone does not guarantee in-region processing.
Use the model-specific data-residency commitments before treating an endpoint as a processing boundary.
Global
documented
Publication date unavailable Reviewed 2026-09-18 primary
Page 1 of 4
Four numbers that need labels
Mapped feature
≠ facility
A point, building outline, and campus polygon may describe the same place.
MW
needs a basis
Critical IT, gross service, interconnection, generation, and planned buildout are different.
PUE
facility ÷ IT
Efficiency ratio—not total demand, useful work, carbon, or water.
Water
withdrawal ≠ consumption
Returned water, evaporation, source, watershed, and season all matter.
Megawatts can mean critical IT load, total facility service, an interconnection request, onsite generation, or a future buildout. GPU count can describe one building, a campus, a distributed cluster, or an operator's global portfolio. PUE divides total facility energy by IT energy; it says nothing by itself about total demand, carbon, water, embodied hardware, or useful work. Water use can mean withdrawal, discharge, or consumption.
The page therefore refuses to turn every disclosure into a single leaderboard. The honest unit is a dated claim with a boundary.
The room became part of the computer
The lineage begins before the phrase "data center." The publicly unveiled ENIAC occupied about 1,000 square feet, used roughly 18,000 vacuum tubes, and weighed about 30 tons in 1946; it was an ancestor, not a modern facility. NIST's SEAC then became the first fully operational stored-program electronic computer in the United States in 1950. The physical plant and the computer occupied nearly the same world. IBM launched the compatible System/360 family on April 7, 1964, letting institutions expand centralized computing without replacing their entire software environment at every step. Both the ENIAC history and Google's per-prompt water methodology below are also included in the downloadable source ledger.
The decisive hyperscale shift was not merely putting more servers in a larger building. In 2003, Google described search clusters with more than 15,000 commodity PCs and a filesystem designed around routine component failure. AWS put storage and compute behind on-demand APIs in 2006. In 2009, Google described the data center itself as one warehouse-scale computer: servers, network, software, power, and cooling designed together. Facebook then published clean-sheet server, rack, power, and facility ideas through Open Compute in 2011.
AI changed the density and the scale of the supporting systems. It did not invent centralized computing, industrial cooling, or large electricity demand.
From computer room to AI campus
The building slowly became part of the computer
Focus or select a dated event. The timeline separates documented milestones from company retrospectives and modeled national estimates.
2009 · hyperscale
The warehouse becomes the computer
Schematic only: cabinet count is illustrative and does not encode historical machine quantities.
Changes
Google described servers, network, software, power, and cooling as one warehouse-scale machine.
Effect on the service
The useful unit was no longer a server rack; it was a whole facility co-designed around one service fleet.
Evidence boundary
Novel as a whole-system engineering frame, not the invention of centralized computing or cooling.
Google treated ordinary component failure as a software assumption, stripped servers to the functions its fleet needed, built distributed storage and networking around enormous clusters, and optimized power and cooling at the scale of the whole service. The useful computer became the coordinated warehouse rather than the most reliable individual box.
That is a more precise claim than saying Google invented the data center. Mainframe rooms, colocation facilities, supercomputers, telecommunications exchanges, and industrial cooling all have longer histories. Google's published contribution was the unusually complete co-design of cheap machines, fault-tolerant software, network, power, cooling, and operations at internet scale.
Google's use of active cooling predates the last few years. Its 2012 "Hot Huts" disclosure showed sealed hot aisles, forced air, pumps, and facility water cooling. In 2018, DeepMind described autonomous controls adjusting cooling setpoints every five minutes from thousands of sensors. The widely repeated 40% result referred to cooling energy, not total facility electricity.
The AI-era change was that liquid moved closer to the heat source. Google says TPU v3, deployed in 2018, was its first direct-liquid-cooled TPU generation. By 2025, it was describing accelerators above 1,000 watts, machine-learning racks expected to exceed 500 kilowatts before 2030, and power and cooling designs capable of supporting a 1 megawatt rack. Those company roadmap and capability statements do not describe the density of an average rack.
Follow one watt through the building
Electricity enters through utility lines and substations, passes transformers, switchgear, batteries or UPS systems, and power distribution, then reaches CPUs, accelerators, memory, storage, and network equipment. Inside the computing boundary, almost all of it ends as heat.
That heat must cross several interfaces: the silicon junction, thermal material, heat spreader, heat sink or cold plate, server or rack loop, facility loop, and finally an outdoor sink. Small amounts of energy can leave as light, signals, or stored energy, so "almost all" is more defensible than a boundary-free 100%.
An exploded heat journey
Every watt needs a path in—and almost every watt needs a path back out
Select a stage, then build a cooling system with two independent decisions: how heat leaves the rack and how it finally leaves the site.
Server
Accelerator junction
Medium: Electrical work → heat
Transistors switch, memory moves data, and almost all input electricity becomes heat inside the facility boundary.
Water
Still no requirement for water at the silicon itself.
Sound
The chip is not the loud part; its supporting fans and pumps are.
Boundary
Small amounts of energy leave as signals or stored energy, so the page says “almost all,” not a boundary-free 100%.
Decision 1 · capture at the rack
Decision 2 · reject beyond the facility
The heat finishes in outdoor air without routine evaporation.
Water: Low direct cooling-water consumption; upstream electricity and chip-fab water remain.
Sound: Outdoor fans are continuous or load-varying sound sources.
Tradeoff: Hot design days can require more coil area, fan energy, or supplemental refrigeration.
Liquid cooling describes heat capture and transport—not the final heat sink.
The cooling vocabulary becomes much clearer when it is split into two independent decisions.
First, how does heat leave the rack? Fans can force room air through heat sinks. A rear-door exchanger can intercept hot exhaust. Cold plates can carry heat directly from processor packages into a sealed technology loop. Immersion can place electronics in dielectric fluid.
Second, how does heat leave the site? A dry cooler can blow outdoor air over a closed coil. A mechanical chiller can move heat across a difficult temperature difference. A cooling tower can evaporate water. A river, lake, or sea can absorb heat through an indirect exchanger. A district-heating or industrial customer can use some of it when temperature, distance, timing, and economics align.
These choices can be mixed. A liquid-cooled rack can finish at a dry cooler with little routine onsite evaporation. An air-cooled server can hand heat to a water-cooled chiller and evaporative tower. "Air cooled" does not mean passive, and "liquid cooled" does not mean water consuming.
"Passive cooling" usually means natural convection or building features that need little mechanical work. It is not a realistic complete heat path for today's dense AI racks. An airside economizer still needs controlled airflow, filtration, humidity management, and usually fans. A CRAC unit uses a refrigeration cycle at or near the computer room; a CRAH unit blows room air across a chilled-water coil supplied by a central plant. Both are air cooling at the server and active cooling at the facility.
The Department of Energy's data-center guide describes airside and waterside economizers, containment, cold plates, immersion, chillers, and liquid loops. "Free cooling" means compressor work is reduced or avoided under suitable conditions; fans, pumps, filtration, controls, and the final heat sink remain.
Why do AI facilities need to be so large?
They do not all need to be.
Large-model training repeatedly synchronizes work across accelerators. Those machines exchange parameters, activations, checkpoints, and failures through extremely fast local networks. A large campus can share a substation, cooling plant, storage system, security boundary, operations team, and low-latency fabric. Dense racks reduce floor count, but they increase the intensity of power delivery and heat removal around each rack.
Inference creates a different geography. Smaller sites near population centers can reduce latency, keep regulated data inside a jurisdiction, improve failure isolation, and sometimes find nearby heat customers. Distribution also duplicates spare capacity and operations, consumes expensive land, and turns a local fabric into slower and less predictable wide-area links. The workload determines whether concentration or distribution is valuable.
Density calculator
Denser racks can still need a larger campus
These are transparent design arithmetic—not a forecast for a named facility. Change actual average IT load, rack density, and PUE.
1,000
illustrative racks
120
facility MW
20
overhead MW
One logical machine
Dense racks reduce floor count; they do not remove the systems around them.
Substations + redundancy
Low-latency fabric
Cooling plant + loops
Storage + checkpointing
Security + failure domains
Fiber + utility corridors
Staged buildings
Operations + repair
Why not scatter every rack? Synchronous training needs accelerators to exchange data through extremely fast local fabrics. Smaller sites are valuable for inference, resilience, sovereignty, and heat reuse, but wide-area links create latency, bandwidth, and failure boundaries. The workload decides.
The calculator is arithmetic, not a forecast. Actual average IT load divided by average rack density produces an illustrative rack count. Multiplying IT load by PUE estimates facility load. None of those inputs can be safely inferred from a press release that announces land, utility service, or eventual campus capacity.
Why are data centers loud?
The chips are not usually what a neighbor hears. Sound comes from the equipment that feeds them and removes their heat.
Server fans, computer-room air handlers, rooftop units, cooling towers, and dry coolers move extraordinary volumes of air. Fan turbulence creates broadband sound while blades, motors, and bearings can create repeating tones. Chillers, compressors, and pumps add mechanical tones and structure-borne vibration. Transformers can produce a persistent low-frequency hum. Generator tests add combustion, exhaust, radiator-fan, and mechanical sound; an outage can make many units operate together.
The acoustic footprint
A quiet number can still hide a persistent tone
This is a source explorer, not a synthetic sound-level prediction. A defensible measurement needs distance, weather, operating state, background, spectrum, and protocol.
Bars indicate source activity and spectral visibility only. They do not encode decibels.
Selected source
Transformers
Electromagnetic forces vibrate the core and enclosure at persistent frequencies.
Virginia’s JLARC found resident-regarded problematic noise at at least 15 operational sites—about 10% of the state’s then-known sites. It is not a national prevalence estimate.
29%
Of 131 sites across eight reviewed Virginia localities were within 200 feet of residential zoning. That is zoning distance, not building-to-home distance.
dBA ≠ whole story
Low-frequency and tonal sound can remain noticeable at night even when an aggregate A-weighted limit is met.
A single A-weighted decibel number cannot describe every experience. Tonal or low-frequency sound may remain noticeable at night as background levels fall, and A-weighting can understate part of that spectrum. A defensible study needs source operating state, simultaneous load, distance, barriers, topography, weather, background, duration, and frequency bands. Source sound power is not the same as sound pressure at a home.
Virginia's 2024 legislative audit found resident-regarded problematic noise at at least 15 operating sites, roughly 10% of the state's then-known sites. That finding describes Virginia. It does not estimate national prevalence. Better controls include larger slower fans, variable speed, quieter transformer designs, acoustic enclosures and louvers, vibration isolation, setbacks, barriers, equipment orientation, daytime staggered generator tests, and baseline plus post-opening spectral monitoring.
Why use water? Can it be reused forever?
Evaporation can reject a great deal of heat with less compressor energy than all-dry cooling under favorable conditions. That trade is why water appears in many facilities. The DOE cooling schematic follows heat from racks to room air, chilled water, a chiller, a condenser loop, and a cooling tower.
Three water ledgers must stay separate:
Withdrawal is water entering the site.
Discharge is water returned to a sewer, river, or other destination.
Consumption is withdrawal minus discharge, usually dominated by evaporation at a wet-cooled site.
In a cooling tower, makeup replaces evaporation, blowdown, and a small amount of drift. The evaporated molecules have left the liquid system. Meanwhile, calcium, magnesium, chloride, silica, and other dissolved material remain and concentrate. Without controlled blowdown, treatment, and monitoring, scale blocks heat transfer, salts corrode equipment, and biological growth creates operational and health risks.
The water ledger
The closed loop is reusable. The evaporated water is gone.
Model site WUE separately from a normalized cooling-tower chemistry loop. The first calculator uses actual average IT load, not a campus announcement or interconnection ceiling.
Annual site-water scenario
115.7M gal/year
438,000,000 liters = MW × 8,760 h × 1,000 kWh/MWh × WUE. This is scenario arithmetic, not a named-campus prediction.
Alphabet-owned and fully leased data centers under its operational-control boundary; excludes seawater returned to sea, is not AI-only, and includes estimates where actual data were unavailable.
Company-estimated median for Gemini Apps text serving under a stated boundary; excludes model training, external networks, end-user devices, and data storage and is not a universal prompt constant.
Filtration can remove suspended particles but not every dissolved ion. Softening, chemistry, ion exchange, and reverse osmosis can raise safe cycles of concentration. Reverse osmosis produces a reusable permeate and a smaller, saltier reject stream. Zero-liquid-discharge systems add energy, chemicals, maintenance, and solids disposal. Condensing evaporated exhaust moisture requires another colder sink and more energy, undoing much of the reason the tower was used.
The DOE cooling-tower guidance says typical systems operate around two to four cycles of concentration and that higher cycles can reduce makeup and blowdown where local chemistry allows. That is not permission to apply one target everywhere.
How much water do data centers use?
Lawrence Berkeley National Laboratory modeled approximately 17.4 billion U.S. gallons of direct water consumption by all U.S. data centers in 2023. It also modeled roughly 211 billion gallons associated with electricity generation. The 2024 LBNL report is a national scenario model. It cannot supply an AI-only total, a complete facility-meter census, or a number for one provider.
Alphabet's limited-assurance statement reports that Google's global data-center fleet withdrew 13.562 billion gallons, discharged 3.039 billion gallons, and consumed 10.523 billion gallons in 2025. The reporting methodology allows estimates where direct records were unavailable. These are fleet totals, not a Gemini allocation.
Google separately estimated that a median Gemini Apps text prompt in May 2025 consumed 0.26 milliliters of water under its stated serving boundary. The company study excludes model training, external networking, end-user devices, and data storage. The estimate describes that measured service population. Other services can have different water use per prompt.
Water also has a place and a season. A modest annual share can still collide with a small utility's peak day or a drought. Reclaimed municipal water can reduce demand for potable supply, but it still needs treatment and produces discharge or residuals. Dry cooling can reduce direct site consumption while raising electricity use, shifting some water and emissions into the power system.
Why not build in cold places or beside the ocean?
Cold outdoor air expands the hours when a facility can reduce compressor work. It does not remove the thermal interfaces between a high-power chip and the environment, and it does not answer the other siting questions: grid capacity, fiber, latency, data sovereignty, workforce, construction logistics, smoke, humidity, ice, drought, hazards, permits, and redundancy. A site must still survive its hot design day.
Training jobs can often tolerate more geographic distance. Latency-sensitive inference, content delivery, and regulated data often cannot. Cold weather is an engineering input, not a complete siting strategy.
Ocean water is possible too. Google's Hamina site reuses a former paper mill and existing tunnel to exchange heat indirectly with the Bay of Finland. Seawater does not flow through its servers. Microsoft's Project Natick operated a sealed research module on the North Sea floor from 2018 to 2020. Natick was an experiment, not a commercial fleet design.
Siting is a multi-variable problem
Cold air and ocean water solve one piece—not the whole location
Switch the workload lens, then inspect a site archetype. The interface does not produce a fake universal score because power, fiber, latency, water, hazards, sovereignty, workforce, and permits change by project.
Cold, remote region
Location-flexible training or batch work when power, fiber, and jurisdiction also work.
Marine cooling brings chloride corrosion, biofouling, intake screening, pumps, tunnels, heat exchangers, thermal discharge, coastal storms, and permitting. Water withdrawal can be high even when consumptive evaporation is low. The EPA's cooling-water intake work documents the risk of impinging larger organisms on screens and entraining eggs and larvae. Hamina is compelling partly because unusual industrial infrastructure was already there; it is not a template that every coastline can copy.
Map the public data-center records
The broad atlas below freezes public OpenStreetMap features carrying documented data-center tags. It includes points, building outlines, and campus or site geometries. Those objects can overlap: one point, three buildings, and a campus polygon may all describe the same real place. Tags can be incomplete, stale, inconsistent, or absent.
The map therefore counts mapped features, not facilities. A construction tag does not prove completion. The lack of a construction tag does not prove operation. Operator and owner tags are preserved separately. A community record does not establish tenant, workload, chips, power, cooling, water, permit status, or capacity.
A broad map with a narrow claim
The public can map thousands of features—but not see inside most of them
The frozen layer includes OSM points, buildings, and campus/site outlines matching documented data-center tags. They overlap and are incomplete, so the number is never called a facility count.
The 1,896-feature geography waits to load until this atlas approaches the viewport.
The empty fields are a result, not a defect. The public can see much of the industrial geography while remaining unable to answer what is operating inside it.
For a narrower set of AI campuses, the next atlas uses company, regulator, utility, and government disclosures. Each dossier keeps the landowner, developer, operator, cloud, workload customer, utility relationship, hardware, power, water, cooling, status, and unknown fields distinct. A company can occupy several roles without owning the whole stack. Google may control a model, accelerator design, network, cloud, and much of a campus while depending on a foundry, memory makers, utility, grid, and builders. xAI may control Grok and Colossus while depending on NVIDIA hardware, electric and water utilities, pipelines, and the manufacturing chain below the accelerator.
Primary-source AI campus atlas
Facility geography
Select a mapped campus, then follow its workload, utility, grid, and water evidence
Public evidence, not telemetry. Grid region is not delivered electricity, a PPA or annual matching claim is not an hourly facility mix, and cooling design is not measured water consumption.
Partially operationalStatus evidence as of Apr 29, 2026 · last reviewed Sep 4, 2026
Stargate I — Abilene
Abilene, Texas, United States
Crusoe says two 100 MW buildings were energized by March 27; Lancium’s CEO described three buildings as running full out on April 9; and OpenAI confirms GB200 systems are running. These milestones do not disclose meter demand or live critical-IT megawatts.
6
explicit unknowns
Organizations and roles
Oracleoperator
The live site runs on Oracle Cloud Infrastructure; this does not resolve every campus operating entity.
Crusoedeveloper
Crusoe identifies itself as the developer that constructed and energized the first two 100 MW buildings; this is building electrical capacity, not measured load.
Lanciumdeveloper
Lancium describes Stargate I as its flagship Abilene Clean Campus project.
OpenAItenant
OpenAI reports running its own early training, inference, and frontier-research workloads.
NVIDIAhardware provider
Oracle began delivering NVIDIA GB200 racks in June 2025, and OpenAI later confirmed GB200 systems running at Abilene. No rack, superchip, or GPU count is public.
AEP Texaselectric utility
AEP Texas North Division constructed the Lancium terminal SCADA, metering, and initial 138 kV point of interconnection. This identifies the TSP/TDSP meter party, not the competitive retail supplier, LSE, or QSE.
Electric Reliability Council of Texasgrid operator
The campus is in ERCOT. ERCOT’s public large-load reporting is aggregated and does not provide facility interval load or an hourly delivered fuel mix.
Capacity without false precision
200 MWenergized electric service
Two 100 MW buildings at the original Abilene project were constructed and energized.
Boundary: This is energized building nameplate and a defensible minimum, not instantaneous or average demand, critical-IT load, or proof that every megawatt was serving compute.
1.2 GWapproved grid interconnect
Lancium says the Abilene campus has an ERCOT-approved 1.2 GW interconnect.
Boundary: Interconnection capacity is neither measured demand nor evidence that 1.2 GW of compute is operating.
Workloads and hardware
OpenAI training and inference, including GPT-5.5 training
OpenAI names GPT-5.5 training at Abilene but does not publish workload share, run dates, live compute megawatts, or model-to-building allocation.
NVIDIA GB200
OpenAI confirms GB200 systems run at Abilene, but installed rack, superchip, accelerator, and GPU counts remain undisclosed. The wider Stargate portfolio’s chip count is not allocated here.
Power and water boundaries
Grid / utility
AEP Texas · ERCOT
AEP Texas is the identified TSP/TDSP and POI metering party, not necessarily the energy seller. The REP/LSE/QSE, interval net imports and exports, on-site-generation netting, and facility-specific hourly fuel mix remain undisclosed; an energized interconnect is not delivered load.
Water
Closed-loop cooling designed to recirculate an initial fill rather than use ongoing evaporative cooling water.
Lancium’s CEO gave an operator-stated March 2026 campus usage rate of 20 gallons per minute while three buildings and roughly 8,500 on-site workers were active. No underlying meter or bill was produced, the rate’s averaging method is unstated, and city water was not split into potable, raw, reclaimed, cooling, domestic, or construction use; it is therefore not encoded as measuredConsumption. The city’s approximately 2 million-gallon-per-year figure for buildings 1–8 is an operating forecast, not a reading.
Questions still worth reporting
What are the per-building critical-IT megawatts, average and peak meter demand, installed GB200 rack count, and installed superchip or GPU count?
Who are the REP/LSE and QSE, and what are interval net imports, exports, on-site-generation netting, and monthly energy and peak demand?
What do the municipal meter records show for potable, raw, reclaimed, cooling, domestic, and construction water separately?
States that two 100 MW buildings at the original Abilene project were constructed and energized. Energized building capacity is not measured demand or critical-IT load.
Texas House of Representatives · published/filed 2026-04-09 · government
At 02:56:14–02:56:36, Lancium CEO Michael McNamara describes three buildings as running full out and reports an operator-stated March 2026 campus water-use rate of 20 gallons per minute. No underlying meter record or source-class split is supplied.
Public Utility Commission of Texas · published/filed 2023-08-01 · primary
PUCT Project No. 54468, item 244. The month-only report date is normalized to month start. Projects T10433134/P21743001 and T10434308/P21743002 identify SCADA, metering at the Lancium terminal, and the 138 kV tie for a 200 MW data center, energized June 30, 2023.
Electric Reliability Council of Texas · published/filed 2025-07-31 · primary
Approved protocol revision requires public large-load status reporting to be aggregated because customer-specific information is confidential; it does not supply Abilene interval load.
City of Abilene · published/filed 2026-01-08 · government
City presentation gives an approximately 2 million-gallon-per-year operational projection for original buildings 1–8. It is a forecast, not metered use.
Living page reviewed on the recorded date. Oracle reports 42% of Abilene capacity delivered and says Port Washington customer delivery begins in the second half of 2027; neither statement is a regulator-approved in-service date or measured load.
Reporter lead desk
The gaps are part of the dataset
These are unresolved, source-specific questions—not allegations. They point to the permits, utility dockets, customer allocations, and cooling disclosures that would materially improve the public map.
SpainPermitting
AWS El Burgo de Ebro data center
Status evidence as of Jun 21, 2024 · last reviewed Aug 15, 2026
The reviewed sources establish a 2020 DIA/AAI and a 2024 fourth phase of electrical-infrastructure approval at El Espartal II. Electrical approval and nameplate do not establish current draw, occupancy or operating compute.
What construction, occupancy, first-load and first-party operating evidence establishes current status?
This is a missing-record question, not a claim supported by two arbitrarily selected citations.
Status evidence as of Jun 21, 2024 · last reviewed Aug 15, 2026
The reviewed sources establish a 2020 DIA/AAI and a 2024 fourth phase of electrical-infrastructure approval at El Espartal II. Electrical approval and nameplate do not establish current draw, occupancy or operating compute.
What measured load, cooling, water and workload allocation applies specifically to El Burgo?
This is a missing-record question, not a claim supported by two arbitrarily selected citations.
Status evidence as of Jul 1, 2025 · last reviewed Aug 15, 2026
The reviewed sources establish the original Huesca PLHUS campus, a 2020 DIA/AAI, and later program modifications. They do not independently establish current operation, so the passport remains at the latest supportable permit/planning boundary. PLHUS is not Walqa/WQA.
What first-party or occupancy evidence establishes construction, energization and current operation at PLHUS?
This is a missing-record question, not a claim supported by two arbitrarily selected citations.
Status evidence as of Jul 1, 2025 · last reviewed Aug 15, 2026
The reviewed sources establish the original Huesca PLHUS campus, a 2020 DIA/AAI, and later program modifications. They do not independently establish current operation, so the passport remains at the latest supportable permit/planning boundary. PLHUS is not Walqa/WQA.
What measured load, water and workload allocation applies specifically to this campus?
This is a missing-record question, not a claim supported by two arbitrarily selected citations.
Status evidence as of Jan 14, 2025 · last reviewed Aug 15, 2026
MDEQ records a synthetic-minor air construction permit for Amazon Data Services at the named Madison Mega Site. Mississippi announced two complexes, but only this named site is materialized; a permit does not establish construction completion, occupancy or operation.
What notice to proceed, inspections, building permits, occupancy and energization apply to this named site?
This is a missing-record question, not a claim supported by two arbitrarily selected citations.
Status evidence as of Jan 14, 2025 · last reviewed Aug 15, 2026
MDEQ records a synthetic-minor air construction permit for Amazon Data Services at the named Madison Mega Site. Mississippi announced two complexes, but only this named site is materialized; a permit does not establish construction completion, occupancy or operation.
What site-specific record identifies the second announced Madison County complex without inventing a facility?
This is a missing-record question, not a claim supported by two arbitrarily selected citations.
Status evidence as of Aug 10, 2020 · last reviewed Aug 15, 2026
The reviewed sources establish the original campus and its 2020 DIA/AAI. The permit’s 294.4 MWt nominal thermal backup-generator figure is not electrical MW, IT load, current draw or proof of operation.
What construction, occupancy, first-load and first-party operating evidence establishes current status?
This is a missing-record question, not a claim supported by two arbitrarily selected citations.
Status evidence as of Aug 10, 2020 · last reviewed Aug 15, 2026
The reviewed sources establish the original campus and its 2020 DIA/AAI. The permit’s 294.4 MWt nominal thermal backup-generator figure is not electrical MW, IT load, current draw or proof of operation.
What measured electrical load, cooling, water and workload allocation applies specifically to Villanueva?
This is a missing-record question, not a claim supported by two arbitrarily selected citations.
Status evidence as of May 14, 2026 · last reviewed Aug 15, 2026
WQA has a site-specific April 2026 DIA/AAI and conditional external-hydraulic EIA. These permits establish a distinct Walqa expansion campus, not construction, occupancy or operation, and it must not be merged with Huesca PLHUS.
What construction permit, mobilization, occupancy and energization follow the environmental authorizations?
This is a missing-record question, not a claim supported by two arbitrarily selected citations.
Status evidence as of May 14, 2026 · last reviewed Aug 15, 2026
WQA has a site-specific April 2026 DIA/AAI and conditional external-hydraulic EIA. These permits establish a distinct Walqa expansion campus, not construction, occupancy or operation, and it must not be merged with Huesca PLHUS.
What final hydraulic design and measured water quantities apply?
This is a missing-record question, not a claim supported by two arbitrarily selected citations.
Status evidence as of Jul 30, 2026 · last reviewed Sep 4, 2026
The Campus IA joint venture (MGX, Bpifrance, Mistral AI, NVIDIA) completed a CNDP concertation from October 13 to November 23, 2025, and a public inquiry covering environmental authorization, building permits, and grid connection ran from April 30 to May 30, 2026. The ministerial answer of July 30, 2026 says 700 MW has been contracted with RTE, and the municipality reports a pending building permit with construction beginning in 2027. A completed inquiry and a contracted connection are not issued permits, construction, or energization; the May 2025 schedule of construction in H2 2026 is superseded.
What are the enforceable water, noise, and heat-recovery conditions, and which phase-2 cooling technology is selected?
This is a missing-record question, not a claim supported by two arbitrarily selected citations.
Status evidence as of Jul 30, 2026 · last reviewed Sep 4, 2026
The Campus IA joint venture (MGX, Bpifrance, Mistral AI, NVIDIA) completed a CNDP concertation from October 13 to November 23, 2025, and a public inquiry covering environmental authorization, building permits, and grid connection ran from April 30 to May 30, 2026. The ministerial answer of July 30, 2026 says 700 MW has been contracted with RTE, and the municipality reports a pending building permit with construction beginning in 2027. A completed inquiry and a contracted connection are not issued permits, construction, or energization; the May 2025 schedule of construction in H2 2026 is superseded.
Which client contracts, accelerator orders, and workload allocations, if any, are bound to phase 1?
This is a missing-record question, not a claim supported by two arbitrarily selected citations.
Status evidence as of Jul 30, 2026 · last reviewed Sep 4, 2026
The Campus IA joint venture (MGX, Bpifrance, Mistral AI, NVIDIA) completed a CNDP concertation from October 13 to November 23, 2025, and a public inquiry covering environmental authorization, building permits, and grid connection ran from April 30 to May 30, 2026. The ministerial answer of July 30, 2026 says 700 MW has been contracted with RTE, and the municipality reports a pending building permit with construction beginning in 2027. A completed inquiry and a contracted connection are not issued permits, construction, or energization; the May 2025 schedule of construction in H2 2026 is superseded.
Which environmental authorization, building permits, and RTE connection agreement have been issued, and when does construction actually begin?
This is a missing-record question, not a claim supported by two arbitrarily selected citations.
Status evidence as of Mar 31, 2026 · last reviewed Aug 15, 2026
An eight-building concept is in EIA and zoning. The authority records no final investment decision. Land purchase, an EIA program, and a zoning proposal do not establish construction or an operating campus.
Which cooling alternative, if any, is selected and what enforceable and measured water quantities result?
This is a missing-record question, not a claim supported by two arbitrarily selected citations.
Status evidence as of Mar 31, 2026 · last reviewed Aug 15, 2026
An eight-building concept is in EIA and zoning. The authority records no final investment decision. Land purchase, an EIA program, and a zoning proposal do not establish construction or an operating campus.
Will Google make a final investment decision, and what final EIA, zoning, building and environmental permits follow?
This is a missing-record question, not a claim supported by two arbitrarily selected citations.
Status evidence as of Apr 29, 2026 · last reviewed Aug 15, 2026
A nine-building campus remains in EIA, land-use, and zoning stages. The municipality explicitly says Google has not made a final investment decision. The €26 million land-use agreement is not a notice to proceed.
Which cooling alternative, water source, ecological conditions, and measured quantities will apply?
This is a missing-record question, not a claim supported by two arbitrarily selected citations.
Status evidence as of Apr 29, 2026 · last reviewed Aug 15, 2026
A nine-building campus remains in EIA, land-use, and zoning stages. The municipality explicitly says Google has not made a final investment decision. The €26 million land-use agreement is not a notice to proceed.
Will the project receive a final investment decision and final EIA, zoning, building and environmental approvals?
This is a missing-record question, not a claim supported by two arbitrarily selected citations.
Status evidence as of Feb 12, 2026 · last reviewed Sep 4, 2026
Environmental monitoring records a 2025-10-14 site visit and pre-construction environmental measures while explicitly placing the project before the construction phase. Reparcelation, project-area figures and monitoring do not establish construction, completed data halls, electric service or production compute. The Consejería de Fomento definitively approved the reparcelation project by resolution of August 7, 2026, published in DOCM no. 160 on August 21, 2026; that closes regional land management and allows construction projects and municipal licences to be requested, but it is not a building permit, construction start, or energization.
What as-built cooling, water, grid and workload allocations apply to each phase?
This is a missing-record question, not a claim supported by two arbitrarily selected citations.
Status evidence as of Feb 12, 2026 · last reviewed Sep 4, 2026
Environmental monitoring records a 2025-10-14 site visit and pre-construction environmental measures while explicitly placing the project before the construction phase. Reparcelation, project-area figures and monitoring do not establish construction, completed data halls, electric service or production compute. The Consejería de Fomento definitively approved the reparcelation project by resolution of August 7, 2026, published in DOCM no. 160 on August 21, 2026; that closes regional land management and allows construction projects and municipal licences to be requested, but it is not a building permit, construction start, or energization.
Which construction projects, sectoral authorizations, and municipal building licences have been filed or granted after the August 2026 reparcelation approval, and when do works start?
This is a missing-record question, not a claim supported by two arbitrarily selected citations.
Status evidence as of Feb 12, 2026 · last reviewed Sep 4, 2026
Environmental monitoring records a 2025-10-14 site visit and pre-construction environmental measures while explicitly placing the project before the construction phase. Reparcelation, project-area figures and monitoring do not establish construction, completed data halls, electric service or production compute. The Consejería de Fomento definitively approved the reparcelation project by resolution of August 7, 2026, published in DOCM no. 160 on August 21, 2026; that closes regional land management and allows construction projects and municipal licences to be requested, but it is not a building permit, construction start, or energization.
Which enabling works have progressed to data-hall permits, occupancy, energization and production compute?
This is a missing-record question, not a claim supported by two arbitrarily selected citations.
Status evidence as of Jul 15, 2026 · last reviewed Aug 15, 2026
Aragón records a phased PIGA, hydraulic-infrastructure design and expropriation process. The approximately 25,000 m² building concept and regional investment announcement do not establish mobilization, completed shells, energization or compute.
What enforceable and measured water quantities apply to the selected design?
This is a missing-record question, not a claim supported by two arbitrarily selected citations.
Status evidence as of Jul 15, 2026 · last reviewed Aug 15, 2026
Aragón records a phased PIGA, hydraulic-infrastructure design and expropriation process. The approximately 25,000 m² building concept and regional investment announcement do not establish mobilization, completed shells, energization or compute.
What final site permits, construction notice, occupancy, energization and production milestones follow?
This is a missing-record question, not a claim supported by two arbitrarily selected citations.
Microsoft Villamayor de Gállego data-center campus
Status evidence as of Jan 13, 2026 · last reviewed Aug 15, 2026
The campus has a redelineated PIGA boundary and scheduled expropriation acts. It is distinct from La Muela, the Zaragoza municipal campus, Clave logistics, and Tillion Aragón. Land assembly is not construction or operation.
What final PIGA, building and environmental approvals precede mobilization?
This is a missing-record question, not a claim supported by two arbitrarily selected citations.
Microsoft Villamayor de Gállego data-center campus
Status evidence as of Jan 13, 2026 · last reviewed Aug 15, 2026
The campus has a redelineated PIGA boundary and scheduled expropriation acts. It is distinct from La Muela, the Zaragoza municipal campus, Clave logistics, and Tillion Aragón. Land assembly is not construction or operation.
Which parcels and auxiliary infrastructure belong exclusively to Microsoft rather than adjacent projects?
This is a missing-record question, not a claim supported by two arbitrarily selected citations.
Status evidence as of Mar 24, 2025 · last reviewed Aug 15, 2026
The municipality-of-Zaragoza campus was declared an investment of autonomic and general interest. A projected 2026 phase-1 investment after partial final PIGA approval is prospective and does not establish approval, spend, mobilization or operation.
Has partial final PIGA approval occurred, and what site permits and physical construction follow?
This is a missing-record question, not a claim supported by two arbitrarily selected citations.
Status evidence as of Mar 24, 2025 · last reviewed Aug 15, 2026
The municipality-of-Zaragoza campus was declared an investment of autonomic and general interest. A projected 2026 phase-1 investment after partial final PIGA approval is prospective and does not establish approval, spend, mobilization or operation.
What campus-specific capacity, cooling, utility and water records supersede portfolio investment intent?
This is a missing-record question, not a claim supported by two arbitrarily selected citations.
Project Jade AI campus and Cheyenne Power Hub — Laramie County
Status evidence as of Jan 6, 2026 · last reviewed Sep 4, 2026
Laramie County commissioners unanimously approved site plans on January 6, 2026 for the Project Jade data-center campus and Tallgrass’s adjacent BFC Power and Cheyenne Power Hub gas generation at the Switchgrass Industrial Park south of Cheyenne. Crusoe, the original data-center developer, exited in spring 2026 per local reporting, and Tallgrass says work continues directly with the customer. Black Hills’ Wyoming Electric reports a 1.8 GW prospective data-center customer with $377 million of refundable advances and definitive agreements still under negotiation as of August 2026. County site-plan approval and reported earthwork are not data-hall building permits, energization, or compute.
What air permits, construction records, and commissioning dates apply to the Cheyenne Power Hub generation and to the first data-center building?
This is a missing-record question, not a claim supported by two arbitrarily selected citations.
Project Jade AI campus and Cheyenne Power Hub — Laramie County
Status evidence as of Jan 6, 2026 · last reviewed Sep 4, 2026
Laramie County commissioners unanimously approved site plans on January 6, 2026 for the Project Jade data-center campus and Tallgrass’s adjacent BFC Power and Cheyenne Power Hub gas generation at the Switchgrass Industrial Park south of Cheyenne. Crusoe, the original data-center developer, exited in spring 2026 per local reporting, and Tallgrass says work continues directly with the customer. Black Hills’ Wyoming Electric reports a 1.8 GW prospective data-center customer with $377 million of refundable advances and definitive agreements still under negotiation as of August 2026. County site-plan approval and reported earthwork are not data-hall building permits, energization, or compute.
What water rights, well permits, and metered withdrawals apply to the Lance Formation plan?
This is a missing-record question, not a claim supported by two arbitrarily selected citations.
Project Jade AI campus and Cheyenne Power Hub — Laramie County
Status evidence as of Jan 6, 2026 · last reviewed Sep 4, 2026
Laramie County commissioners unanimously approved site plans on January 6, 2026 for the Project Jade data-center campus and Tallgrass’s adjacent BFC Power and Cheyenne Power Hub gas generation at the Switchgrass Industrial Park south of Cheyenne. Crusoe, the original data-center developer, exited in spring 2026 per local reporting, and Tallgrass says work continues directly with the customer. Black Hills’ Wyoming Electric reports a 1.8 GW prospective data-center customer with $377 million of refundable advances and definitive agreements still under negotiation as of August 2026. County site-plan approval and reported earthwork are not data-hall building permits, energization, or compute.
Who is the data-center customer and developer after Crusoe’s exit, and which definitive Black Hills agreements, tariff approvals, and CPCN orders have been issued?
This is a missing-record question, not a claim supported by two arbitrarily selected citations.
Status evidence as of Aug 11, 2026 · last reviewed Sep 4, 2026
The municipality signed a protocol of intent in November 2024 for a R$3 billion first phase, Scala reported a Ministry of Mines and Energy approval of a 5 GW connection to the national system in May 2025, and an August 2026 event report says the project is in environmental, urban-planning, and road licensing with operations expected by the end of 2028. A connection approval and a protocol of intent are not licences, construction, or energization, and no construction start is established.
What transmission works, substation, and supplier contracts implement the reported 5 GW connection approval, and at what schedule?
This is a missing-record question, not a claim supported by two arbitrarily selected citations.
Status evidence as of Aug 11, 2026 · last reviewed Sep 4, 2026
The municipality signed a protocol of intent in November 2024 for a R$3 billion first phase, Scala reported a Ministry of Mines and Energy approval of a 5 GW connection to the national system in May 2025, and an August 2026 event report says the project is in environmental, urban-planning, and road licensing with operations expected by the end of 2028. A connection approval and a protocol of intent are not licences, construction, or energization, and no construction start is established.
Which cooling design and water source are licensed, and what tenants or workloads are contracted for phase 1?
This is a missing-record question, not a claim supported by two arbitrarily selected citations.
Status evidence as of Aug 11, 2026 · last reviewed Sep 4, 2026
The municipality signed a protocol of intent in November 2024 for a R$3 billion first phase, Scala reported a Ministry of Mines and Energy approval of a 5 GW connection to the national system in May 2025, and an August 2026 event report says the project is in environmental, urban-planning, and road licensing with operations expected by the end of 2028. A connection approval and a protocol of intent are not licences, construction, or energization, and no construction start is established.
Which environmental, urban, and road licences have been issued, and when does first-phase construction start?
This is a missing-record question, not a claim supported by two arbitrarily selected citations.
AWS Richmond County campus — Energy Way Industrial Park
Status evidence as of Jun 4, 2025 · last reviewed Sep 4, 2026
North Carolina, EDPNC, and Amazon announced a $10 billion cloud and AI campus in Richmond County on June 4, 2025. County economic-development material says the Energy Way site near Hamlet is zoned heavy industrial, will be powered by Duke Energy, and expected site preparation to begin by the end of 2025, while local reporting records up to 20 buildings and an incentive agreement requiring at least 50 jobs and $1 billion by 2030. The reviewed record establishes announcement and intent; no permit, mobilization, or energization record was reviewed.
What Duke Energy service agreement, MW envelope, and interval load apply, and is any of the campus tied to Project Rainier or Trainium deployments?
This is a missing-record question, not a claim supported by two arbitrarily selected citations.
AWS Richmond County campus — Energy Way Industrial Park
Status evidence as of Jun 4, 2025 · last reviewed Sep 4, 2026
North Carolina, EDPNC, and Amazon announced a $10 billion cloud and AI campus in Richmond County on June 4, 2025. County economic-development material says the Energy Way site near Hamlet is zoned heavy industrial, will be powered by Duke Energy, and expected site preparation to begin by the end of 2025, while local reporting records up to 20 buildings and an incentive agreement requiring at least 50 jobs and $1 billion by 2030. The reviewed record establishes announcement and intent; no permit, mobilization, or energization record was reviewed.
What water allocation, meter, and discharge records define the verified-excess commitment?
This is a missing-record question, not a claim supported by two arbitrarily selected citations.
AWS Richmond County campus — Energy Way Industrial Park
Status evidence as of Jun 4, 2025 · last reviewed Sep 4, 2026
North Carolina, EDPNC, and Amazon announced a $10 billion cloud and AI campus in Richmond County on June 4, 2025. County economic-development material says the Energy Way site near Hamlet is zoned heavy industrial, will be powered by Duke Energy, and expected site preparation to begin by the end of 2025, while local reporting records up to 20 buildings and an incentive agreement requiring at least 50 jobs and $1 billion by 2030. The reviewed record establishes announcement and intent; no permit, mobilization, or energization record was reviewed.
Which grading, building, air (backup generator), and stormwater permits have been issued, and has construction mobilized on the first buildings?
This is a missing-record question, not a claim supported by two arbitrarily selected citations.
Status evidence as of Apr 1, 2026 · last reviewed Aug 15, 2026
The state announced a planned $3 billion Warren County campus and expected construction to begin in 2026. County overview material does not substitute for a parcel, environmental/building permit, mobilization or operating milestone.
What parcel, permit-holder, MDEQ/building permit and physical mobilization establish the exact project boundary?
This is a missing-record question, not a claim supported by two arbitrarily selected citations.
Status evidence as of Apr 1, 2026 · last reviewed Aug 15, 2026
The state announced a planned $3 billion Warren County campus and expected construction to begin in 2026. County overview material does not substitute for a parcel, environmental/building permit, mobilization or operating milestone.
What utility, service envelope, cooling and water design are ultimately approved?
This is a missing-record question, not a claim supported by two arbitrarily selected citations.
Status evidence as of Aug 5, 2026 · last reviewed Sep 4, 2026
TeraWulf describes the Abernathy Joint Venture as a 168 MW critical-IT AI data center campus in Abernathy, Texas and in July 2026 agreed to sell its entire 50.1% interest to a Fluidstack-led investor group for about $530 million, with Fluidstack continuing to lead the project. Anthropic’s $50 billion program names Texas and Fluidstack but not Abernathy, and no reviewed primary record names the Abernathy tenant, a construction start, an interconnection, or an in-service date.
Did the TeraWulf interest sale close, and which entity owns and operates the campus afterward?
This is a missing-record question, not a claim supported by two arbitrarily selected citations.
Status evidence as of Aug 5, 2026 · last reviewed Sep 4, 2026
TeraWulf describes the Abernathy Joint Venture as a 168 MW critical-IT AI data center campus in Abernathy, Texas and in July 2026 agreed to sell its entire 50.1% interest to a Fluidstack-led investor group for about $530 million, with Fluidstack continuing to lead the project. Anthropic’s $50 billion program names Texas and Fluidstack but not Abernathy, and no reviewed primary record names the Abernathy tenant, a construction start, an interconnection, or an in-service date.
What interconnection, utility service, construction, and in-service records exist for the 168 MW design?
This is a missing-record question, not a claim supported by two arbitrarily selected citations.
Status evidence as of Aug 5, 2026 · last reviewed Sep 4, 2026
TeraWulf describes the Abernathy Joint Venture as a 168 MW critical-IT AI data center campus in Abernathy, Texas and in July 2026 agreed to sell its entire 50.1% interest to a Fluidstack-led investor group for about $530 million, with Fluidstack continuing to lead the project. Anthropic’s $50 billion program names Texas and Fluidstack but not Abernathy, and no reviewed primary record names the Abernathy tenant, a construction start, an interconnection, or an in-service date.
Which tenant, if any, has leased Abernathy, and does the Anthropic–Fluidstack Texas program refer to this site?
This is a missing-record question, not a claim supported by two arbitrarily selected citations.
Status evidence as of Nov 1, 2024 · last reviewed Sep 4, 2026
Google announced a US$1 billion Thailand investment covering a Chonburi data center and a Bangkok cloud region on September 30, 2024, and the Board of Investment approved a 32.8 billion baht investment by Alphabet subsidiary Quartz Computing Co., Ltd. for a hyperscale data center in Chonburi on November 1, 2024. Investment promotion is not a permit, construction start, or operation, and the early-2027 opening reported by journalism is a forecast. Secondary aggregator sites claim a January 2026 launch without a reviewed primary record, so the status stays at announced.
What MW, cooling design, and water source are specified, and which utility will serve the site?
This is a missing-record question, not a claim supported by two arbitrarily selected citations.
Status evidence as of Nov 1, 2024 · last reviewed Sep 4, 2026
Google announced a US$1 billion Thailand investment covering a Chonburi data center and a Bangkok cloud region on September 30, 2024, and the Board of Investment approved a 32.8 billion baht investment by Alphabet subsidiary Quartz Computing Co., Ltd. for a hyperscale data center in Chonburi on November 1, 2024. Investment promotion is not a permit, construction start, or operation, and the early-2027 opening reported by journalism is a forecast. Secondary aggregator sites claim a January 2026 launch without a reviewed primary record, so the status stays at announced.
What primary record, if any, establishes a service-entry or live-operation date?
This is a missing-record question, not a claim supported by two arbitrarily selected citations.
Status evidence as of Nov 1, 2024 · last reviewed Sep 4, 2026
Google announced a US$1 billion Thailand investment covering a Chonburi data center and a Bangkok cloud region on September 30, 2024, and the Board of Investment approved a 32.8 billion baht investment by Alphabet subsidiary Quartz Computing Co., Ltd. for a hyperscale data center in Chonburi on November 1, 2024. Investment promotion is not a permit, construction start, or operation, and the early-2027 opening reported by journalism is a forecast. Secondary aggregator sites claim a January 2026 launch without a reviewed primary record, so the status stays at announced.
Which Thai building, environmental, and electricity-connection approvals have been issued for the Chonburi site, and has construction started?
This is a missing-record question, not a claim supported by two arbitrarily selected citations.
Google Meitner Energy Center data center — Gray and Roberts Counties
Status evidence as of Jun 4, 2026 · last reviewed Sep 4, 2026
Google and Intersect announced construction of the Meitner Energy Center on June 4, 2026, which includes a new data center to be built directly alongside more than a gigawatt of wind, solar, and storage with minority on-site gas firming; Intersect lists the energy center as in construction. Google’s locations page treats the Pampa-area campus as a 2026 announcement. The reviewed record establishes energy-center construction and a planned data center, not data-center construction, energization, or compute.
What MW of load, gas-firming capacity, and grid interconnection (SPP or ERCOT) apply?
This is a missing-record question, not a claim supported by two arbitrarily selected citations.
Google Meitner Energy Center data center — Gray and Roberts Counties
Status evidence as of Jun 4, 2026 · last reviewed Sep 4, 2026
Google and Intersect announced construction of the Meitner Energy Center on June 4, 2026, which includes a new data center to be built directly alongside more than a gigawatt of wind, solar, and storage with minority on-site gas firming; Intersect lists the energy center as in construction. Google’s locations page treats the Pampa-area campus as a 2026 announcement. The reviewed record establishes energy-center construction and a planned data center, not data-center construction, energization, or compute.
When does the data center itself receive permits, mobilize, energize, and enter production, separately from the energy center?
This is a missing-record question, not a claim supported by two arbitrarily selected citations.
Status evidence as of Sep 1, 2026 · last reviewed Sep 4, 2026
SB Energy’s September 2026 S-1 says it has executed a definitive OpenAI lease for the campus, which is not yet under construction, and that none of its data-center capacity is in operation. NVIDIA and SB Energy announced the lease and NVIDIA credit support on August 17, 2026, AEP Ohio announced 765 kV transmission plans on March 20, 2026 that still require Ohio Power Siting Board approval, and the project site describes a 2026 construction start as a plan. Contracted GW-IT, planned gas generation, and transmission investment are not construction, energization, or compute.
What water source, cooling design, and withdrawal or discharge permits apply to the campus?
This is a missing-record question, not a claim supported by two arbitrarily selected citations.
Status evidence as of Sep 1, 2026 · last reviewed Sep 4, 2026
SB Energy’s September 2026 S-1 says it has executed a definitive OpenAI lease for the campus, which is not yet under construction, and that none of its data-center capacity is in operation. NVIDIA and SB Energy announced the lease and NVIDIA credit support on August 17, 2026, AEP Ohio announced 765 kV transmission plans on March 20, 2026 that still require Ohio Power Siting Board approval, and the project site describes a 2026 construction start as a plan. Contracted GW-IT, planned gas generation, and transmission investment are not construction, energization, or compute.
Which Ohio Power Siting Board, PUCO, air, water, and land-transfer approvals have been filed or issued for the campus, its 765 kV lines, and the planned gas generation, and when does physical construction begin?
This is a missing-record question, not a claim supported by two arbitrarily selected citations.
Status evidence as of Sep 1, 2026 · last reviewed Sep 4, 2026
SB Energy’s September 2026 S-1 says it has executed a definitive OpenAI lease for the campus, which is not yet under construction, and that none of its data-center capacity is in operation. NVIDIA and SB Energy announced the lease and NVIDIA credit support on August 17, 2026, AEP Ohio announced 765 kV transmission plans on March 20, 2026 that still require Ohio Power Siting Board approval, and the project site describes a 2026 construction start as a plan. Contracted GW-IT, planned gas generation, and transmission investment are not construction, energization, or compute.
Which building tranche, MW, accelerator delivery, and AEP service milestone marks first energization and the first OpenAI workload in 2028?
This is a missing-record question, not a claim supported by two arbitrarily selected citations.
Status evidence as of Aug 27, 2026 · last reviewed Sep 4, 2026
OpenAI describes Project Camellia as a data center it is designing and developing on a 1,400-acre site at the Savannah Gateway Industrial Hub. Georgia Power’s service agreement for up to 3,200 MW delivered in phases from 2028 through 2032 cleared Public Service Commission staff review without objection in late August 2026, and the county describes a five-phase PILOT schedule with payments beginning in 2027. A cleared power contract and county revenue projections are not permits, construction, energization, or compute.
What do Georgia Power’s executed contract, phased ramp schedule, demand-response terms, and future interval meters show for each phase?
This is a missing-record question, not a claim supported by two arbitrarily selected citations.
Status evidence as of Aug 27, 2026 · last reviewed Sep 4, 2026
OpenAI describes Project Camellia as a data center it is designing and developing on a 1,400-acre site at the Savannah Gateway Industrial Hub. Georgia Power’s service agreement for up to 3,200 MW delivered in phases from 2028 through 2032 cleared Public Service Commission staff review without objection in late August 2026, and the county describes a five-phase PILOT schedule with payments beginning in 2027. A cleared power contract and county revenue projections are not permits, construction, energization, or compute.
Which rezoning, PILOT, site-development, air, and water permits have been issued, and when does construction start on the first phase?
This is a missing-record question, not a claim supported by two arbitrarily selected citations.
Status evidence as of Aug 27, 2026 · last reviewed Sep 4, 2026
OpenAI describes Project Camellia as a data center it is designing and developing on a 1,400-acre site at the Savannah Gateway Industrial Hub. Georgia Power’s service agreement for up to 3,200 MW delivered in phases from 2028 through 2032 cleared Public Service Commission staff review without objection in late August 2026, and the county describes a five-phase PILOT schedule with payments beginning in 2027. A cleared power contract and county revenue projections are not permits, construction, energization, or compute.
Which surface-water source, treatment plant, and withdrawal or discharge permits will serve the closed-loop system?
This is a missing-record question, not a claim supported by two arbitrarily selected citations.
Status evidence as of Jul 14, 2026 · last reviewed Sep 4, 2026
Pure DC announced on July 14, 2026 a 110 MW phase 1 on a 370-acre Seinäjoki site scalable to 550 MW+, stating that phase 1 is fully leased, that all planning permissions and power requirements are secured, and that a substation for the first data hall is constructed and live. These are company claims; no municipal permit, tenant, construction-start, or delivery-date record was reviewed, so the campus is not promoted beyond announced.
What electricity supplier, contracted capacity, and district-heating connection will serve the campus?
This is a missing-record question, not a claim supported by two arbitrarily selected citations.
Status evidence as of Jul 14, 2026 · last reviewed Sep 4, 2026
Pure DC announced on July 14, 2026 a 110 MW phase 1 on a 370-acre Seinäjoki site scalable to 550 MW+, stating that phase 1 is fully leased, that all planning permissions and power requirements are secured, and that a substation for the first data hall is constructed and live. These are company claims; no municipal permit, tenant, construction-start, or delivery-date record was reviewed, so the campus is not promoted beyond announced.
Which Seinäjoki zoning and building permits, grid-connection agreements, and substation records support the company’s “secured” claims?
This is a missing-record question, not a claim supported by two arbitrarily selected citations.
Status evidence as of Jul 14, 2026 · last reviewed Sep 4, 2026
Pure DC announced on July 14, 2026 a 110 MW phase 1 on a 370-acre Seinäjoki site scalable to 550 MW+, stating that phase 1 is fully leased, that all planning permissions and power requirements are secured, and that a substation for the first data hall is constructed and live. These are company claims; no municipal permit, tenant, construction-start, or delivery-date record was reviewed, so the campus is not promoted beyond announced.
Who is the phase-1 tenant, and what construction-start and delivery dates apply to the first 40 MW module?
This is a missing-record question, not a claim supported by two arbitrarily selected citations.
Riot Platforms Rockdale AI data center (frontier-lab lease)
Status evidence as of Aug 10, 2026 · last reviewed Sep 4, 2026
Riot’s August 2026 results announce a 20-year, $9.1 billion lease of a 191 MW critical-IT build-to-suit Tier 3 data center at its Rockdale campus to one of the world’s leading frontier AI labs, with 96 IT MW expected in December 2027 and the full 191 IT MW by June 2028, using the campus’s existing approved interconnection and a $573 million interim financing facility. Bloomberg, as cited by the Austin American-Statesman, identified the tenant as Anthropic; neither company has confirmed. The existing Rockdale site is a bitcoin-mining campus, and the leased data center is not built.
How is the leased load separated from mining load in ERCOT registration, metering, and demand-response participation?
This is a missing-record question, not a claim supported by two arbitrarily selected citations.
Riot Platforms Rockdale AI data center (frontier-lab lease)
Status evidence as of Aug 10, 2026 · last reviewed Sep 4, 2026
Riot’s August 2026 results announce a 20-year, $9.1 billion lease of a 191 MW critical-IT build-to-suit Tier 3 data center at its Rockdale campus to one of the world’s leading frontier AI labs, with 96 IT MW expected in December 2027 and the full 191 IT MW by June 2028, using the campus’s existing approved interconnection and a $573 million interim financing facility. Bloomberg, as cited by the Austin American-Statesman, identified the tenant as Anthropic; neither company has confirmed. The existing Rockdale site is a bitcoin-mining campus, and the leased data center is not built.
What building, electrical, interconnection-modification, and commissioning records support the December 2027 and June 2028 delivery dates?
This is a missing-record question, not a claim supported by two arbitrarily selected citations.
Riot Platforms Rockdale AI data center (frontier-lab lease)
Status evidence as of Aug 10, 2026 · last reviewed Sep 4, 2026
Riot’s August 2026 results announce a 20-year, $9.1 billion lease of a 191 MW critical-IT build-to-suit Tier 3 data center at its Rockdale campus to one of the world’s leading frontier AI labs, with 96 IT MW expected in December 2027 and the full 191 IT MW by June 2028, using the campus’s existing approved interconnection and a $573 million interim financing facility. Bloomberg, as cited by the Austin American-Statesman, identified the tenant as Anthropic; neither company has confirmed. The existing Rockdale site is a bitcoin-mining campus, and the leased data center is not built.
Which company is the lessee, and has either party confirmed the reported Anthropic identification?
This is a missing-record question, not a claim supported by two arbitrarily selected citations.
Status evidence as of Jan 1, 2026 · last reviewed Sep 4, 2026
SoftBank Corp. announced in June 2024 a data center on about 440,000 m² of the former Sharp Sakai plant with over 150 MW initially and over 400 MW expected, reusing existing power and cooling facilities, with construction targeted for autumn 2024 and full-scale operation in 2025. On January 1, 2026 the company said the Sakai and Tomakomai sites would begin operations sequentially during 2026, which shows the original 2025 target elapsed without a reviewed operating record. No reviewed dated record confirms a construction start, so the status stays at announced rather than under construction. A later company reference to GB200 NVL72 in Japan-based data centers does not name Sakai.
How many GPUs, of which generation, are installed at Sakai as opposed to other SoftBank Japan sites?
This is a missing-record question, not a claim supported by two arbitrarily selected citations.
Status evidence as of Jan 1, 2026 · last reviewed Sep 4, 2026
SoftBank Corp. announced in June 2024 a data center on about 440,000 m² of the former Sharp Sakai plant with over 150 MW initially and over 400 MW expected, reusing existing power and cooling facilities, with construction targeted for autumn 2024 and full-scale operation in 2025. On January 1, 2026 the company said the Sakai and Tomakomai sites would begin operations sequentially during 2026, which shows the original 2025 target elapsed without a reviewed operating record. No reviewed dated record confirms a construction start, so the status stays at announced rather than under construction. A later company reference to GB200 NVL72 in Japan-based data centers does not name Sakai.
What electricity supplier, contracted capacity, and cooling water arrangements serve the reused plant infrastructure?
This is a missing-record question, not a claim supported by two arbitrarily selected citations.
Status evidence as of Jan 1, 2026 · last reviewed Sep 4, 2026
SoftBank Corp. announced in June 2024 a data center on about 440,000 m² of the former Sharp Sakai plant with over 150 MW initially and over 400 MW expected, reusing existing power and cooling facilities, with construction targeted for autumn 2024 and full-scale operation in 2025. On January 1, 2026 the company said the Sakai and Tomakomai sites would begin operations sequentially during 2026, which shows the original 2025 target elapsed without a reviewed operating record. No reviewed dated record confirms a construction start, so the status stays at announced rather than under construction. A later company reference to GB200 NVL72 in Japan-based data centers does not name Sakai.
Which construction, occupancy, and commissioning records establish when the first Sakai phase energized and began serving compute?
This is a missing-record question, not a claim supported by two arbitrarily selected citations.
Status evidence as of Oct 10, 2025 · last reviewed Sep 4, 2026
Sur Energy and OpenAI signed a letter of intent for a data-center project of up to 500 MW and $25 billion at full scale, announced by the Argentine government on October 10, 2025 and framed as a Patagonia project under the RIGI investment regime. By May 28, 2026, reporting quoted the Economy Ministry saying the project had not been presented under RIGI and no site, contract, financing, or permit had been disclosed. A letter of intent is not a site, permit, or construction record.
Has any RIGI application, site option, provincial permit, or grid-connection request been filed for Stargate Argentina, and by which legal entity?
This is a missing-record question, not a claim supported by two arbitrarily selected citations.
Status evidence as of Oct 10, 2025 · last reviewed Sep 4, 2026
Sur Energy and OpenAI signed a letter of intent for a data-center project of up to 500 MW and $25 billion at full scale, announced by the Argentine government on October 10, 2025 and framed as a Patagonia project under the RIGI investment regime. By May 28, 2026, reporting quoted the Economy Ministry saying the project had not been presented under RIGI and no site, contract, financing, or permit had been disclosed. A letter of intent is not a site, permit, or construction record.
What binding agreement, if any, replaces the October 2025 letter of intent, and does OpenAI hold a capacity contract?
This is a missing-record question, not a claim supported by two arbitrarily selected citations.
Status evidence as of Oct 10, 2025 · last reviewed Sep 4, 2026
Sur Energy and OpenAI signed a letter of intent for a data-center project of up to 500 MW and $25 billion at full scale, announced by the Argentine government on October 10, 2025 and framed as a Patagonia project under the RIGI investment regime. By May 28, 2026, reporting quoted the Economy Ministry saying the project had not been presented under RIGI and no site, contract, financing, or permit had been disclosed. A letter of intent is not a site, permit, or construction record.
Which generation, transmission, and water resources would serve a Patagonian site, and under what approvals?
This is a missing-record question, not a claim supported by two arbitrarily selected citations.
Stargate Korea — SK Telecom / OpenAI southwest site
Status evidence as of Oct 1, 2025 · last reviewed Sep 4, 2026
SK Group recorded an SK Telecom MOU with OpenAI on October 1, 2025 to collaborate on an AI data center in the southwest region of Korea as part of “Stargate Korea”. Journalism places the site in Jeollanam-do with 20 MW of initial capacity, and February 2026 reporting said the construction timeline was still under review. An MOU and reported province are not a site, permit, contract, or construction record.
Has the MOU become a binding agreement with a capacity contract, and what is the first-phase MW and schedule?
This is a missing-record question, not a claim supported by two arbitrarily selected citations.
Stargate Korea — SK Telecom / OpenAI southwest site
Status evidence as of Oct 1, 2025 · last reviewed Sep 4, 2026
SK Group recorded an SK Telecom MOU with OpenAI on October 1, 2025 to collaborate on an AI data center in the southwest region of Korea as part of “Stargate Korea”. Journalism places the site in Jeollanam-do with 20 MW of initial capacity, and February 2026 reporting said the construction timeline was still under review. An MOU and reported province are not a site, permit, contract, or construction record.
Which electricity supply, cooling, and water arrangements would serve the site?
This is a missing-record question, not a claim supported by two arbitrarily selected citations.
Stargate Korea — SK Telecom / OpenAI southwest site
Status evidence as of Oct 1, 2025 · last reviewed Sep 4, 2026
SK Group recorded an SK Telecom MOU with OpenAI on October 1, 2025 to collaborate on an AI data center in the southwest region of Korea as part of “Stargate Korea”. Journalism places the site in Jeollanam-do with 20 MW of initial capacity, and February 2026 reporting said the construction timeline was still under review. An MOU and reported province are not a site, permit, contract, or construction record.
Which site, legal owner, permit, and grid-connection request define the southwest Stargate Korea data center?
This is a missing-record question, not a claim supported by two arbitrarily selected citations.
Status evidence as of Jul 15, 2026 · last reviewed Aug 14, 2026
The OpenAI offtake was exploratory and later paused, and the UK government said Cobalt Park was discussing alternative offtakers. A later ministerial answer describes OpenAI’s program-wide Stargate UK decision as a pause during a global infrastructure recalibration rather than termination or a UK-specific decision, but does not name Cobalt Park. No reviewed record shows Cobalt-specific resumed offtake, a substitute customer, Stargate construction, commissioning, or operating compute.
Has OpenAI or another named customer executed a Cobalt Park GPU-offtake agreement, and what site-specific model and quantity does it allocate?
This is a missing-record question, not a claim supported by two arbitrarily selected citations.
Status evidence as of Jul 15, 2026 · last reviewed Aug 14, 2026
The OpenAI offtake was exploratory and later paused, and the UK government said Cobalt Park was discussing alternative offtakers. A later ministerial answer describes OpenAI’s program-wide Stargate UK decision as a pause during a global infrastructure recalibration rather than termination or a UK-specific decision, but does not name Cobalt Park. No reviewed record shows Cobalt-specific resumed offtake, a substitute customer, Stargate construction, commissioning, or operating compute.
What Stargate-specific power-service, meter, cooling design, water-source, permit, and consumption records exist apart from the incumbent Stellium campus?
This is a missing-record question, not a claim supported by two arbitrarily selected citations.
Status evidence as of Jul 15, 2026 · last reviewed Aug 14, 2026
The OpenAI offtake was exploratory and later paused, and the UK government said Cobalt Park was discussing alternative offtakers. A later ministerial answer describes OpenAI’s program-wide Stargate UK decision as a pause during a global infrastructure recalibration rather than termination or a UK-specific decision, but does not name Cobalt Park. No reviewed record shows Cobalt-specific resumed offtake, a substitute customer, Stargate construction, commissioning, or operating compute.
What dated contract amendment, notice to proceed, or substitute offtake would resolve the government’s pause framing into a current project state?
This is a missing-record question, not a claim supported by two arbitrarily selected citations.
Status evidence as of Jul 15, 2026 · last reviewed Aug 14, 2026
The OpenAI offtake was exploratory and later paused, and the UK government said Cobalt Park was discussing alternative offtakers. A later ministerial answer describes OpenAI’s program-wide Stargate UK decision as a pause during a global infrastructure recalibration rather than termination or a UK-specific decision, but does not name Cobalt Park. No reviewed record shows Cobalt-specific resumed offtake, a substitute customer, Stargate construction, commissioning, or operating compute.
Which exact Cobalt building or parcel is under a Stargate contract, and what dated planning, construction, commissioning, or acceptance records apply?
This is a missing-record question, not a claim supported by two arbitrarily selected citations.
TeraWulf Justified Data Campus — Hawesville (Anthropic lease)
Status evidence as of Aug 5, 2026 · last reviewed Sep 4, 2026
TeraWulf reports a 20-year lease with Anthropic for approximately 401 MW of critical IT capacity at the Justified Data Campus, with initial delivery expected in the second half of 2027 and full delivery by early 2028, and describes the campus as having access to up to about 480 MW of gross power, an energized on-site substation, existing high-voltage transmission, and more than 250 buildable acres. A lease, substation, and acreage are not building permits, construction, or delivered compute.
What building, electrical, air, and water permits, construction mobilization, and utility service agreements support the second-half-2027 delivery?
This is a missing-record question, not a claim supported by two arbitrarily selected citations.
TeraWulf Justified Data Campus — Hawesville (Anthropic lease)
Status evidence as of Aug 5, 2026 · last reviewed Sep 4, 2026
TeraWulf reports a 20-year lease with Anthropic for approximately 401 MW of critical IT capacity at the Justified Data Campus, with initial delivery expected in the second half of 2027 and full delivery by early 2028, and describes the campus as having access to up to about 480 MW of gross power, an energized on-site substation, existing high-voltage transmission, and more than 250 buildable acres. A lease, substation, and acreage are not building permits, construction, or delivered compute.
Which Anthropic models, accelerators, and quantities will be allocated to Hawesville rather than Anthropic’s broader portfolio?
This is a missing-record question, not a claim supported by two arbitrarily selected citations.
TeraWulf Justified Data Campus — Hawesville (Anthropic lease)
Status evidence as of Aug 5, 2026 · last reviewed Sep 4, 2026
TeraWulf reports a 20-year lease with Anthropic for approximately 401 MW of critical IT capacity at the Justified Data Campus, with initial delivery expected in the second half of 2027 and full delivery by early 2028, and describes the campus as having access to up to about 480 MW of gross power, an energized on-site substation, existing high-voltage transmission, and more than 250 buildable acres. A lease, substation, and acreage are not building permits, construction, or delivered compute.
Which utility, substation rating, and interval records define the 480 MW gross-power claim, and what generation mix physically serves it?
This is a missing-record question, not a claim supported by two arbitrarily selected citations.
Status evidence as of Jun 4, 2026 · last reviewed Sep 4, 2026
Google announced the Armstrong County campus in November 2025 as part of a $40 billion Texas program and in June 2026 described data centers under construction in Armstrong, Haskell, and Wilbarger Counties. Local reporting says the site covers about 1,300 acres near Claude, that Crusoe has built since May 2025, and that completion is expected in late 2028 or early 2029, while Google’s living locations page still labels the campus planned. Construction is not energization or compute.
What accelerator, model, and workload allocation, if any, is site-bound rather than fleet-level?
This is a missing-record question, not a claim supported by two arbitrarily selected citations.
Status evidence as of Jun 4, 2026 · last reviewed Sep 4, 2026
Google announced the Armstrong County campus in November 2025 as part of a $40 billion Texas program and in June 2026 described data centers under construction in Armstrong, Haskell, and Wilbarger Counties. Local reporting says the site covers about 1,300 acres near Claude, that Crusoe has built since May 2025, and that completion is expected in late 2028 or early 2029, while Google’s living locations page still labels the campus planned. Construction is not energization or compute.
What as-built cooling design and metered water apply?
This is a missing-record question, not a claim supported by two arbitrarily selected citations.
Status evidence as of Jun 4, 2026 · last reviewed Sep 4, 2026
Google announced the Armstrong County campus in November 2025 as part of a $40 billion Texas program and in June 2026 described data centers under construction in Armstrong, Haskell, and Wilbarger Counties. Local reporting says the site covers about 1,300 acres near Claude, that Crusoe has built since May 2025, and that completion is expected in late 2028 or early 2029, while Google’s living locations page still labels the campus planned. Construction is not energization or compute.
Which parcels, building permits, and ERCOT interconnection records define the campus, and what MW is requested?
This is a missing-record question, not a claim supported by two arbitrarily selected citations.
Status evidence as of Sep 4, 2026 · last reviewed Sep 4, 2026
Google’s current location page labels the site under development, and Uruguay’s presidency described it as under construction during an April 2026 visit. No reviewed record establishes a commissioned compute phase.
What do UTE and Parque de las Ciencias records show about electric service, interval load, cooling water, commissioning fill, potable use, wastewater, withdrawal, and consumption?
This is a missing-record question, not a claim supported by two arbitrarily selected citations.
Status evidence as of Sep 4, 2026 · last reviewed Sep 4, 2026
Google’s current location page labels the site under development, and Uruguay’s presidency described it as under construction during an April 2026 visit. No reviewed record establishes a commissioned compute phase.
What facility and critical-IT MW, transformer ratings, modular energization dates, installed accelerators, and named model or product allocations apply at Canelones?
This is a missing-record question, not a claim supported by two arbitrarily selected citations.
Status evidence as of Sep 4, 2026 · last reviewed Sep 4, 2026
Google’s current location page labels the site under development, and Uruguay’s presidency described it as under construction during an April 2026 visit. No reviewed record establishes a commissioned compute phase.
Which operational authorization, occupancy record, UTE first-load record, or Google commissioning notice establishes the first live compute phase at Canelones?
This is a missing-record question, not a claim supported by two arbitrarily selected citations.
Status evidence as of Jul 28, 2026 · last reviewed Aug 14, 2026
The first 49-acre facility’s powered shell and core was completed and handed to Pearl Computing on April 1, 2026. Sime Darby Property later said the 20-year hyperscale lease came on stream in April 2026, corroborating that property chronology. Neither shell handover nor economic lease commencement establishes tenant IT commissioning or production compute, and both sharpen rather than resolve Air Selangor’s conflicting statement that a Google data center operated in 2025.
What do title, lease, affiliate, and design records show about the first 49-acre facility’s owner, lessor, lessee, Google relationship, and gross or critical-IT capacity?
This is a missing-record question, not a claim supported by two arbitrarily selected citations.
Status evidence as of Jul 28, 2026 · last reviewed Aug 14, 2026
The first 49-acre facility’s powered shell and core was completed and handed to Pearl Computing on April 1, 2026. Sime Darby Property later said the 20-year hyperscale lease came on stream in April 2026, corroborating that property chronology. Neither shell handover nor economic lease commencement establishes tenant IT commissioning or production compute, and both sharpen rather than resolve Air Selangor’s conflicting statement that a Google data center operated in 2025.
What legal and technical milestones did “lease came on stream” include, and did any occur after shell handover but before tenant fit-out, TNB first energy, or production acceptance?
This is a missing-record question, not a claim supported by two arbitrarily selected citations.
Status evidence as of Jul 28, 2026 · last reviewed Aug 14, 2026
The first 49-acre facility’s powered shell and core was completed and handed to Pearl Computing on April 1, 2026. Sime Darby Property later said the 20-year hyperscale lease came on stream in April 2026, corroborating that property chronology. Neither shell handover nor economic lease commencement establishes tenant IT commissioning or production compute, and both sharpen rather than resolve Air Selangor’s conflicting statement that a Google data center operated in 2025.
Which chips, models and workloads are site-bound at the first Elmina facility, and what do TNB, PPA, and Air Selangor records show about physical power and measured water?
This is a missing-record question, not a claim supported by two arbitrarily selected citations.
Status evidence as of Jul 28, 2026 · last reviewed Aug 14, 2026
The first 49-acre facility’s powered shell and core was completed and handed to Pearl Computing on April 1, 2026. Sime Darby Property later said the 20-year hyperscale lease came on stream in April 2026, corroborating that property chronology. Neither shell handover nor economic lease commencement establishes tenant IT commissioning or production compute, and both sharpen rather than resolve Air Selangor’s conflicting statement that a Google data center operated in 2025.
Which tenant fit-out, occupancy, TNB first-energy, or Google commissioning record reconciles the April 2026 shell handover with Air Selangor’s statement that a data center operated in 2025?
This is a missing-record question, not a claim supported by two arbitrarily selected citations.
Google Haskell County data center (Quantum co-located campus)
Status evidence as of Jun 4, 2026 · last reviewed Sep 4, 2026
Google and Intersect say the Haskell County data center recently began construction as of June 4, 2026 and that Intersect’s co-located Quantum project of 640 MW solar and 1.3 GWh storage begins operations that month. Google announced two Haskell County data centers in November 2025; only the Quantum-co-located campus is materialized here. Co-location and generation operation are not data-center energization or compute.
What share of hourly demand is physically served by co-located solar, storage, and on-site gas versus the grid?
This is a missing-record question, not a claim supported by two arbitrarily selected citations.
Google Haskell County data center (Quantum co-located campus)
Status evidence as of Jun 4, 2026 · last reviewed Sep 4, 2026
Google and Intersect say the Haskell County data center recently began construction as of June 4, 2026 and that Intersect’s co-located Quantum project of 640 MW solar and 1.3 GWh storage begins operations that month. Google announced two Haskell County data centers in November 2025; only the Quantum-co-located campus is materialized here. Co-location and generation operation are not data-center energization or compute.
Where is the second announced Haskell County data center, and which records materialize it?
This is a missing-record question, not a claim supported by two arbitrarily selected citations.
Google Haskell County data center (Quantum co-located campus)
Status evidence as of Jun 4, 2026 · last reviewed Sep 4, 2026
Google and Intersect say the Haskell County data center recently began construction as of June 4, 2026 and that Intersect’s co-located Quantum project of 640 MW solar and 1.3 GWh storage begins operations that month. Google announced two Haskell County data centers in November 2025; only the Quantum-co-located campus is materialized here. Co-location and generation operation are not data-center energization or compute.
Which building permits, interconnection records, and utility service define the data-center load separately from Quantum’s generation?
This is a missing-record question, not a claim supported by two arbitrarily selected citations.
Status evidence as of Mar 14, 2024 · last reviewed Aug 15, 2026
Google said construction began in 2023 and projected operation in 2025. No reviewed 2025–2026 primary record confirms live operation, so the expired target does not promote the campus. The City GIS layer must be feature-matched before it can update status.
What occupancy, commissioning, first-load or Google live-service record resolves the elapsed 2025 target?
This is a missing-record question, not a claim supported by two arbitrarily selected citations.
Status evidence as of Mar 14, 2024 · last reviewed Aug 15, 2026
Google said construction began in 2023 and projected operation in 2025. No reviewed 2025–2026 primary record confirms live operation, so the expired target does not promote the campus. The City GIS layer must be feature-matched before it can update status.
Which exact City GIS feature and parcel belong to Google/Redale, and what current status does it report?
This is a missing-record question, not a claim supported by two arbitrarily selected citations.
Status evidence as of May 13, 2026 · last reviewed Aug 15, 2026
Skien records Google’s February 2024 build decision, while NVE and pollution-control records establish construction power and permitted building-support systems. Building 2 remains at electrical authorization and pollution-permit-hearing stages. None of these records establishes occupancy, first load, or production compute.
What as-built cooling system and measured withdrawal, consumption, and discharge apply to each building?
This is a missing-record question, not a claim supported by two arbitrarily selected citations.
Status evidence as of May 13, 2026 · last reviewed Aug 15, 2026
Skien records Google’s February 2024 build decision, while NVE and pollution-control records establish construction power and permitted building-support systems. Building 2 remains at electrical authorization and pollution-permit-hearing stages. None of these records establishes occupancy, first load, or production compute.
What occupancy, commissioning, first-load, and production-traffic records establish each building milestone?
This is a missing-record question, not a claim supported by two arbitrarily selected citations.
Status evidence as of Apr 28, 2026 · last reviewed Sep 4, 2026
Google announced a $15 billion, 2026–2030 gigawatt-scale AI hub in October 2025 and reported a groundbreaking at Tarluvada on April 28, 2026 that it describes as the start of construction. Partners AdaniConneX and Nxtra by Airtel are named as developers. A groundbreaking is not a building, energization, or compute milestone, and “gigawatt-scale” is not a stated capacity.
What transmission, generation, and storage contracts are executed, and which utility will serve the hub?
This is a missing-record question, not a claim supported by two arbitrarily selected citations.
Status evidence as of Apr 28, 2026 · last reviewed Sep 4, 2026
Google announced a $15 billion, 2026–2030 gigawatt-scale AI hub in October 2025 and reported a groundbreaking at Tarluvada on April 28, 2026 that it describes as the start of construction. Partners AdaniConneX and Nxtra by Airtel are named as developers. A groundbreaking is not a building, energization, or compute milestone, and “gigawatt-scale” is not a stated capacity.
Which building permits, land records, and interconnection filings define the first Visakhapatnam campus, its MW, and its owner and operator?
This is a missing-record question, not a claim supported by two arbitrarily selected citations.
Status evidence as of Apr 28, 2026 · last reviewed Sep 4, 2026
Google announced a $15 billion, 2026–2030 gigawatt-scale AI hub in October 2025 and reported a groundbreaking at Tarluvada on April 28, 2026 that it describes as the start of construction. Partners AdaniConneX and Nxtra by Airtel are named as developers. A groundbreaking is not a building, energization, or compute milestone, and “gigawatt-scale” is not a stated capacity.
Which cooling design and water source apply, and what withdrawal or consumption is permitted?
This is a missing-record question, not a claim supported by two arbitrarily selected citations.
Status evidence as of Feb 24, 2026 · last reviewed Sep 4, 2026
Google’s February 2026 announcement describes a Wilbarger County data center under construction alongside new clean power developed by AES, with advanced air-cooling limiting water to critical campus operations; Google’s June 2026 statement repeats that the Wilbarger campus is under construction. Investment, MW, timeline, and the AES project’s technology are not disclosed. Construction is not energization or compute.
What MW, interconnection, utility, and building-permit records define the campus, and when does it energize?
This is a missing-record question, not a claim supported by two arbitrarily selected citations.
Status evidence as of Feb 24, 2026 · last reviewed Sep 4, 2026
Google’s February 2026 announcement describes a Wilbarger County data center under construction alongside new clean power developed by AES, with advanced air-cooling limiting water to critical campus operations; Google’s June 2026 statement repeats that the Wilbarger campus is under construction. Investment, MW, timeline, and the AES project’s technology are not disclosed. Construction is not energization or compute.
What is the AES project’s technology, capacity, and contractual relationship to the site’s hourly load?
This is a missing-record question, not a claim supported by two arbitrarily selected citations.
Status evidence as of Jul 13, 2026 · last reviewed Sep 4, 2026
Meta broke ground in December 2024 and expanded the planned campus to 5 GW of compute. Local reporting attributes a 2028 estimate for a portion to a Meta regional manager, but public LPSC records redact the initial load, service date, ramp, maximum demand, and load factor; no compute phase is publicly commissioned.
Request from Louisiana DCE every GW-01 or GW-1S notice or registration, well serial, aquifer, pumping-rate entry, order, and reported withdrawal for Laidley or Hyperion; from LDEQ and local authorities the permits, applications, discharge-monitoring reports, and Delhi water records; and from LPSC or Entergy the interval meters, ramp, substations, MISO node, curtailments, PPAs, and REC retirements for the site.
This is a missing-record question, not a claim supported by two arbitrarily selected citations.
Status evidence as of Jul 13, 2026 · last reviewed Sep 4, 2026
Meta broke ground in December 2024 and expanded the planned campus to 5 GW of compute. Local reporting attributes a 2028 estimate for a portion to a Meta regional manager, but public LPSC records redact the initial load, service date, ramp, maximum demand, and load factor; no compute phase is publicly commissioned.
Request segregable public portions of the U-37425 electric-service-agreement schedules, amendments, and load studies showing first service, initial MW, ramp, maximum demand, load factor, and any delay notices.
This is a missing-record question, not a claim supported by two arbitrarily selected citations.
Status evidence as of Jul 13, 2026 · last reviewed Sep 4, 2026
Meta broke ground in December 2024 and expanded the planned campus to 5 GW of compute. Local reporting attributes a 2028 estimate for a portion to a Meta regional manager, but public LPSC records redact the initial load, service date, ramp, maximum demand, and load factor; no compute phase is publicly commissioned.
Which chip vendors, products, quantities, named Llama generations, and workload shares—if any—will Meta allocate specifically to Hyperion rather than its global infrastructure portfolio?
This is a missing-record question, not a claim supported by two arbitrarily selected citations.
Status evidence as of Dec 11, 2025 · last reviewed Aug 15, 2026
Meta broke ground in 2024. A utility report later said transmission facilities were substantially complete and feeders were scheduled to energize around December 15, 2025. Service readiness and feeder energization do not establish a consuming tenant load or production compute.
Did feeder energization lead to first load, commissioning or live traffic, and what do interval meters show?
This is a missing-record question, not a claim supported by two arbitrarily selected citations.
Status evidence as of Dec 11, 2025 · last reviewed Aug 15, 2026
Meta broke ground in 2024. A utility report later said transmission facilities were substantially complete and feeders were scheduled to energize around December 15, 2025. Service readiness and feeder energization do not establish a consuming tenant load or production compute.
Did the Cordova project reach COD and how are energy and attributes settled without implying exclusive physical delivery?
This is a missing-record question, not a claim supported by two arbitrarily selected citations.
Status evidence as of Jul 28, 2026 · last reviewed Sep 4, 2026
Meta broke ground in October 2025 on an AI-optimized campus in Northeast El Paso that it says can scale to 1 GW, raised the stated investment from $1.5 billion to more than $10 billion in March 2026, and in July 2026 moved the campus into a venture 80% owned by BlackRock-managed funds that describes it as currently under construction with capacity expected to begin coming online in 2028. El Paso Matters photographed active construction in August 2026. Construction and a financing structure are not energization or compute.
What do El Paso Water meters show against the 2.5 million gallons per day maximum, and how much is cooling versus other use?
This is a missing-record question, not a claim supported by two arbitrarily selected citations.
Status evidence as of Jul 28, 2026 · last reviewed Sep 4, 2026
Meta broke ground in October 2025 on an AI-optimized campus in Northeast El Paso that it says can scale to 1 GW, raised the stated investment from $1.5 billion to more than $10 billion in March 2026, and in July 2026 moved the campus into a venture 80% owned by BlackRock-managed funds that describes it as currently under construction with capacity expected to begin coming online in 2028. El Paso Matters photographed active construction in August 2026. Construction and a financing structure are not energization or compute.
What is the PUCT status of the 366 MW McCloud generation facility and the cost-recovery terms after the bridge period?
This is a missing-record question, not a claim supported by two arbitrarily selected citations.
Status evidence as of Jul 28, 2026 · last reviewed Sep 4, 2026
Meta broke ground in October 2025 on an AI-optimized campus in Northeast El Paso that it says can scale to 1 GW, raised the stated investment from $1.5 billion to more than $10 billion in March 2026, and in July 2026 moved the campus into a venture 80% owned by BlackRock-managed funds that describes it as currently under construction with capacity expected to begin coming online in 2028. El Paso Matters photographed active construction in August 2026. Construction and a financing structure are not energization or compute.
Which buildings and MW reach energization and production compute first in 2028, and what interval load does El Paso Electric record?
This is a missing-record question, not a claim supported by two arbitrarily selected citations.
Status evidence as of Oct 12, 2023 · last reviewed Sep 4, 2026
Meta reported ramping construction in October 2023. A June 2026 TCEQ emissions registration for Stampede Data Center is a permit/certification milestone and does not establish occupancy, electric service or live traffic. Meta’s 2026 Texas overview still lists Temple as under construction with about 100 operational jobs once completed; no published live-traffic milestone was found.
Has Meta published an online or serving-traffic milestone for Temple, and which building does it cover?
This is a missing-record question, not a claim supported by two arbitrarily selected citations.
Status evidence as of Oct 12, 2023 · last reviewed Sep 4, 2026
Meta reported ramping construction in October 2023. A June 2026 TCEQ emissions registration for Stampede Data Center is a permit/certification milestone and does not establish occupancy, electric service or live traffic. Meta’s 2026 Texas overview still lists Temple as under construction with about 100 operational jobs once completed; no published live-traffic milestone was found.
Has any building received occupancy, electric service, commissioned compute or live traffic?
This is a missing-record question, not a claim supported by two arbitrarily selected citations.
Status evidence as of Oct 12, 2023 · last reviewed Sep 4, 2026
Meta reported ramping construction in October 2023. A June 2026 TCEQ emissions registration for Stampede Data Center is a permit/certification milestone and does not establish occupancy, electric service or live traffic. Meta’s 2026 Texas overview still lists Temple as under construction with about 100 operational jobs once completed; no published live-traffic milestone was found.
How are Rowan Stampede LLC and Meta legally related, and what equipment was actually installed under the certification?
This is a missing-record question, not a claim supported by two arbitrarily selected citations.
Status evidence as of Jun 1, 2026 · last reviewed Aug 15, 2026
Phase 1 construction began in late 2024 and a second building permit and second construction phase followed. Microsoft says completion is expected in late 2026 or 2027, with commissioning after construction. Fortum heat production at the site initially uses ambient air and electric boilers and does not establish live Microsoft compute.
When does each building receive occupancy, commissioning, first electric load and production compute?
This is a missing-record question, not a claim supported by two arbitrarily selected citations.
Status evidence as of Jun 1, 2026 · last reviewed Aug 15, 2026
Phase 1 construction began in late 2024 and a second building permit and second construction phase followed. Microsoft says completion is expected in late 2026 or 2027, with commissioning after construction. Fortum heat production at the site initially uses ambient air and electric boilers and does not establish live Microsoft compute.
When does measured Microsoft waste heat replace or supplement ambient-air and electric-boiler heat?
This is a missing-record question, not a claim supported by two arbitrarily selected citations.
Status evidence as of May 6, 2026 · last reviewed Aug 15, 2026
The first phase received a building permit and the later Microsoft update says phase 2 construction starts in 2026. The EIA page corrects a backup-generator typo from 15 MWel to 3.3 MWel each. Fortum heat-plant operation is not campus commissioning.
What are the as-built cooling and measured power, water and recovered-heat quantities?
This is a missing-record question, not a claim supported by two arbitrarily selected citations.
Status evidence as of May 6, 2026 · last reviewed Aug 15, 2026
The first phase received a building permit and the later Microsoft update says phase 2 construction starts in 2026. The EIA page corrects a backup-generator typo from 15 MWel to 3.3 MWel each. Fortum heat-plant operation is not campus commissioning.
Which phase has started physical construction, received occupancy, energized IT load, and entered production?
This is a missing-record question, not a claim supported by two arbitrarily selected citations.
Status evidence as of Apr 28, 2026 · last reviewed Aug 15, 2026
Preconstruction began in September 2024, a cornerstone was laid in May 2025, and a March 2026 building permit included a right to commence. These are construction milestones, not occupancy, commissioning or production compute.
What cooling topology and measured power and water quantities apply?
This is a missing-record question, not a claim supported by two arbitrarily selected citations.
Status evidence as of Apr 28, 2026 · last reviewed Aug 15, 2026
Preconstruction began in September 2024, a cornerstone was laid in May 2025, and a March 2026 building permit included a right to commence. These are construction milestones, not occupancy, commissioning or production compute.
When does each building receive occupancy, commissioning, first load and production compute?
This is a missing-record question, not a claim supported by two arbitrarily selected citations.
Status evidence as of Aug 14, 2026 · last reviewed Sep 4, 2026
Nebius says it will deliver dedicated capacity to Microsoft from a new Vineland data center; its project page describes construction under way by developer DataOne with a Bloom Energy fuel-cell power plan and operations expected by 2027, superseding the September 2025 later-this-year language. In August 2026 Vineland issued stop-work orders for LNG-tank and fuel-cell placement done before permits, and the planning board then approved phase 2 while the on-site power plan awaited approval. Construction and a Microsoft contract are not energization, fuel-cell operation, or compute.
What MW is actually energized, from which supply (fuel cells, grid, or both), and when does Microsoft’s dedicated capacity begin service?
This is a missing-record question, not a claim supported by two arbitrarily selected citations.
Status evidence as of Aug 14, 2026 · last reviewed Sep 4, 2026
Nebius says it will deliver dedicated capacity to Microsoft from a new Vineland data center; its project page describes construction under way by developer DataOne with a Bloom Energy fuel-cell power plan and operations expected by 2027, superseding the September 2025 later-this-year language. In August 2026 Vineland issued stop-work orders for LNG-tank and fuel-cell placement done before permits, and the planning board then approved phase 2 while the on-site power plan awaited approval. Construction and a Microsoft contract are not energization, fuel-cell operation, or compute.
What do city water meters show against the projected annual use?
This is a missing-record question, not a claim supported by two arbitrarily selected citations.
Status evidence as of Aug 14, 2026 · last reviewed Sep 4, 2026
Nebius says it will deliver dedicated capacity to Microsoft from a new Vineland data center; its project page describes construction under way by developer DataOne with a Bloom Energy fuel-cell power plan and operations expected by 2027, superseding the September 2025 later-this-year language. In August 2026 Vineland issued stop-work orders for LNG-tank and fuel-cell placement done before permits, and the planning board then approved phase 2 while the on-site power plan awaited approval. Construction and a Microsoft contract are not energization, fuel-cell operation, or compute.
Which permits and planning-board approvals now cover the LNG storage and Bloom fuel-cell plant, and when does on-site generation commission?
This is a missing-record question, not a claim supported by two arbitrarily selected citations.
Status evidence as of Mar 10, 2026 · last reviewed Aug 14, 2026
Township minutes document active AWS construction and four planned fan-cooled buildings. No reviewed source establishes compute commissioning. The revised front-of-meter power contract began in April 2026, but contract transition is not evidence that the buildings are operating.
What are the current contract ramp, PPL delivery node, meters, and Salem-specific offtake under the front-of-meter structure?
This is a missing-record question, not a claim supported by two arbitrarily selected citations.
Status evidence as of Mar 10, 2026 · last reviewed Aug 14, 2026
Township minutes document active AWS construction and four planned fan-cooled buildings. No reviewed source establishes compute commissioning. The revised front-of-meter power contract began in April 2026, but contract transition is not evidence that the buildings are operating.
What do SRBC meter plans and quarterly reports show for actual withdrawal, consumptive use, source, discharge, and peak-day water?
This is a missing-record question, not a claim supported by two arbitrarily selected citations.
Status evidence as of Mar 10, 2026 · last reviewed Aug 14, 2026
Township minutes document active AWS construction and four planned fan-cooled buildings. No reviewed source establishes compute commissioning. The revised front-of-meter power contract began in April 2026, but contract transition is not evidence that the buildings are operating.
Which building first receives occupancy approval, energized IT load, production workload, and a measured load interval?
This is a missing-record question, not a claim supported by two arbitrarily selected citations.
Status evidence as of Mar 10, 2026 · last reviewed Aug 14, 2026
Township minutes document active AWS construction and four planned fan-cooled buildings. No reviewed source establishes compute commissioning. The revised front-of-meter power contract began in April 2026, but contract transition is not evidence that the buildings are operating.
Which chips, models, customers, and workload shares are bound to PHL100 rather than the statewide AWS investment portfolio?
This is a missing-record question, not a claim supported by two arbitrarily selected citations.
Status evidence as of Feb 9, 2026 · last reviewed Aug 15, 2026
Meta describes Prometheus as underway and says it will reach its stated capacity once complete. It spans more than five conventional buildings, weatherproof tent structures, and adjacent colocation. The pre-existing New Albany campus is operational, but reviewed sources do not identify a commissioned Prometheus phase. New Albany records enumerate several Meta building shells and plan reviews; those physical records do not map one-to-one to the logical Prometheus cluster or prove a commissioned phase.
Did Socrates South enter commercial service, and what dated OPSB, air-permit, pipeline, or developer record resolves the internally inconsistent status evidence?
This is a missing-record question, not a claim supported by two arbitrarily selected citations.
Status evidence as of Feb 9, 2026 · last reviewed Aug 15, 2026
Meta describes Prometheus as underway and says it will reach its stated capacity once complete. It spans more than five conventional buildings, weatherproof tent structures, and adjacent colocation. The pre-existing New Albany campus is operational, but reviewed sources do not identify a commissioned Prometheus phase. New Albany records enumerate several Meta building shells and plan reviews; those physical records do not map one-to-one to the logical Prometheus cluster or prove a commissioned phase.
What AEP service agreement, tariff, ramp, delivery node, meter, and interval-load records apply to each Prometheus phase?
This is a missing-record question, not a claim supported by two arbitrarily selected citations.
Status evidence as of Feb 9, 2026 · last reviewed Aug 15, 2026
Meta describes Prometheus as underway and says it will reach its stated capacity once complete. It spans more than five conventional buildings, weatherproof tent structures, and adjacent colocation. The pre-existing New Albany campus is operational, but reviewed sources do not identify a commissioned Prometheus phase. New Albany records enumerate several Meta building shells and plan reviews; those physical records do not map one-to-one to the logical Prometheus cluster or prove a commissioned phase.
What cooling topology and measured monthly withdrawal, consumption, discharge, source, and peak-day water apply specifically to Prometheus?
This is a missing-record question, not a claim supported by two arbitrarily selected citations.
Status evidence as of Feb 9, 2026 · last reviewed Aug 15, 2026
Meta describes Prometheus as underway and says it will reach its stated capacity once complete. It spans more than five conventional buildings, weatherproof tent structures, and adjacent colocation. The pre-existing New Albany campus is operational, but reviewed sources do not identify a commissioned Prometheus phase. New Albany records enumerate several Meta building shells and plan reviews; those physical records do not map one-to-one to the logical Prometheus cluster or prove a commissioned phase.
Which Prometheus building or colocation phase first receives occupancy, electric service, commissioned compute, and a production workload?
This is a missing-record question, not a claim supported by two arbitrarily selected citations.
Status evidence as of Feb 9, 2026 · last reviewed Aug 15, 2026
Meta describes Prometheus as underway and says it will reach its stated capacity once complete. It spans more than five conventional buildings, weatherproof tent structures, and adjacent colocation. The pre-existing New Albany campus is operational, but reviewed sources do not identify a commissioned Prometheus phase. New Albany records enumerate several Meta building shells and plan reviews; those physical records do not map one-to-one to the logical Prometheus cluster or prove a commissioned phase.
Which named New Albany buildings and colocation phases, if any, does Meta allocate to Prometheus, and when do they receive occupancy and production load?
This is a missing-record question, not a claim supported by two arbitrarily selected citations.
Status evidence as of Aug 29, 2025 · last reviewed Sep 4, 2026
SK Group and AWS announced the Ulsan AI data center in June 2025 with operations scheduled to begin by 2027, and a groundbreaking ceremony on August 29, 2025 was reported by journalism with named SK, AWS Korea, and city officials. SK Telecom’s November 2025 release plans expansion to 1 GW-scale capacity and an LNG power plant with integrated cooling. A reported ceremony and a 1 GW plan are not permits, building completion, energization, or compute.
What LNG generation, grid interconnection, and cooling water arrangements are permitted and contracted for the campus?
This is a missing-record question, not a claim supported by two arbitrarily selected citations.
Status evidence as of Aug 29, 2025 · last reviewed Sep 4, 2026
SK Group and AWS announced the Ulsan AI data center in June 2025 with operations scheduled to begin by 2027, and a groundbreaking ceremony on August 29, 2025 was reported by journalism with named SK, AWS Korea, and city officials. SK Telecom’s November 2025 release plans expansion to 1 GW-scale capacity and an LNG power plant with integrated cooling. A reported ceremony and a 1 GW plan are not permits, building completion, energization, or compute.
Which accelerators and quantities are ordered or installed, and which AWS or SK workloads are bound to Ulsan?
This is a missing-record question, not a claim supported by two arbitrarily selected citations.
Status evidence as of Aug 29, 2025 · last reviewed Sep 4, 2026
SK Group and AWS announced the Ulsan AI data center in June 2025 with operations scheduled to begin by 2027, and a groundbreaking ceremony on August 29, 2025 was reported by journalism with named SK, AWS Korea, and city officials. SK Telecom’s November 2025 release plans expansion to 1 GW-scale capacity and an LNG power plant with integrated cooling. A reported ceremony and a 1 GW plan are not permits, building completion, energization, or compute.
Which building permits, phase MW, and energization dates apply to the first Ulsan phase, and what does the AWS lease cover?
This is a missing-record question, not a claim supported by two arbitrarily selected citations.
Status evidence as of Aug 7, 2026 · last reviewed Aug 14, 2026
Construction remains established. Nscale/Nordkraft announced Nordscale Operations to manage Narvik facilities, with its legal name registered August 7. “Begin operations in 2026” is company/facility-management activity, not compute. Microsoft targets 2027 while Statnett schedules the 420 kV path for 2029; interim or phased service is unresolved, so no failure or energization is inferred.
When are the contracted Vera Rubin systems delivered, accepted, energized, and operating, and what is the installed count?
This is a missing-record question, not a claim supported by two arbitrarily selected citations.
Status evidence as of Aug 7, 2026 · last reviewed Aug 14, 2026
Construction remains established. Nscale/Nordkraft announced Nordscale Operations to manage Narvik facilities, with its legal name registered August 7. “Begin operations in 2026” is company/facility-management activity, not compute. Microsoft targets 2027 while Statnett schedules the 420 kV path for 2029; interim or phased service is unresolved, so no failure or energization is inferred.
Which Nordscale Operations service milestone corresponds to facility management, first energy, customer acceptance, and production compute, respectively?
This is a missing-record question, not a claim supported by two arbitrarily selected citations.
Status evidence as of Aug 7, 2026 · last reviewed Aug 14, 2026
Construction remains established. Nscale/Nordkraft announced Nordscale Operations to manage Narvik facilities, with its legal name registered August 7. “Begin operations in 2026” is company/facility-management activity, not compute. Microsoft targets 2027 while Statnett schedules the 420 kV path for 2029; interim or phased service is unresolved, so no failure or energization is inferred.
Which legal entity now owns each land, building, and compute asset after the joint-venture roll-up?
This is a missing-record question, not a claim supported by two arbitrarily selected citations.
Status evidence as of Aug 7, 2026 · last reviewed Aug 14, 2026
Construction remains established. Nscale/Nordkraft announced Nordscale Operations to manage Narvik facilities, with its legal name registered August 7. “Begin operations in 2026” is company/facility-management activity, not compute. Microsoft targets 2027 while Statnett schedules the 420 kV path for 2029; interim or phased service is unresolved, so no failure or energization is inferred.
Who sells the electricity, what do interval meters show, and what final cooling design, water permits, and water readings apply?
This is a missing-record question, not a claim supported by two arbitrarily selected citations.
Status evidence as of Aug 7, 2026 · last reviewed Aug 14, 2026
Construction remains established. Nscale/Nordkraft announced Nordscale Operations to manage Narvik facilities, with its legal name registered August 7. “Begin operations in 2026” is company/facility-management activity, not compute. Microsoft targets 2027 while Statnett schedules the 420 kV path for 2029; interim or phased service is unresolved, so no failure or energization is inferred.
Will the 2027 Microsoft phase use interim 132 kV service, a revised 420 kV schedule, or another arrangement before Statnett’s stated 2029 capability?
This is a missing-record question, not a claim supported by two arbitrarily selected citations.
Status evidence as of Mar 13, 2026 · last reviewed Aug 14, 2026
G42 and ALEC records describe the first 200 MW phase as under construction. Structural, MEP, procurement, and mechanical-delivery milestones do not establish accelerator delivery, energization, commissioning acceptance, or operating compute.
What SG1-specific power-service, accelerator purchase/delivery, water-source, permit, and meter records can be separated from the broader 2 GW utility scheme?
This is a missing-record question, not a claim supported by two arbitrarily selected citations.
Status evidence as of Mar 13, 2026 · last reviewed Aug 14, 2026
G42 and ALEC records describe the first 200 MW phase as under construction. Structural, MEP, procurement, and mechanical-delivery milestones do not establish accelerator delivery, energization, commissioning acceptance, or operating compute.
What dated utility, commissioning, customer-acceptance, and first-compute records prove any portion of SG1 entered service?
This is a missing-record question, not a claim supported by two arbitrarily selected citations.
Status evidence as of Mar 13, 2026 · last reviewed Aug 14, 2026
G42 and ALEC records describe the first 200 MW phase as under construction. Structural, MEP, procurement, and mechanical-delivery milestones do not establish accelerator delivery, energization, commissioning acceptance, or operating compute.
Which executed operating agreements and GB300 purchase, delivery, installation, and acceptance records convert G42’s launch commitments into current site facts?
This is a missing-record question, not a claim supported by two arbitrarily selected citations.
Status evidence as of Mar 13, 2026 · last reviewed Aug 14, 2026
G42 and ALEC records describe the first 200 MW phase as under construction. Structural, MEP, procurement, and mechanical-delivery milestones do not establish accelerator delivery, energization, commissioning acceptance, or operating compute.
Which legal entities own the land, buildings, electrical/cooling plant, and compute, and which entity will operate the completed facility?
This is a missing-record question, not a claim supported by two arbitrarily selected citations.
Status evidence as of Apr 27, 2026 · last reviewed Sep 4, 2026
Oracle says Project Jupiter construction continued after its April 2026 microgrid redesign. The onsite-generation air application remained under review, and no energized compute phase is asserted.
What final order, enforceable unit count, construction notification, Title V status, first-operation record, and county occupancy milestone results from YGI Microgrid NSR 10883, and how does each generation MW tranche differ from critical IT?
This is a missing-record question, not a claim supported by two arbitrarily selected citations.
Status evidence as of Apr 27, 2026 · last reviewed Sep 4, 2026
Oracle says Project Jupiter construction continued after its April 2026 microgrid redesign. The onsite-generation air application remained under review, and no energized compute phase is asserted.
Which accelerator vendor, generation, rack configuration, quantity, purchase commitment, delivery/acceptance date, and named model workload is allocated to each Project Jupiter data-center building?
This is a missing-record question, not a claim supported by two arbitrarily selected citations.
Status evidence as of Apr 27, 2026 · last reviewed Sep 4, 2026
Oracle says Project Jupiter construction continued after its April 2026 microgrid redesign. The onsite-generation air application remained under review, and no energized compute phase is asserted.
Who owns the contracted industrial-water rights and wells, what OSE/CRRUA/County approvals and volumes apply, and what do meters show separately for office potable use, cooling, fuel-cell fill/top-offs, consumption, and discharge?
This is a missing-record question, not a claim supported by two arbitrarily selected citations.
Status evidence as of Apr 6, 2026 · last reviewed Aug 14, 2026
Municipal records describe a small engineering/design and customer-demonstration proof of concept, not a working or large-scale AI data center. Foxconn’s later testimony says Lordstown manufactures palletized data-center components for shipment by rail and repeats that the site is not a full-scale data center. Factory expansion, substation, water, and storage infrastructure are not evidence of onsite AI compute.
Has the Lordstown proof-of-concept space—not a large-scale data center—received occupancy, electrical, fire, and equipment acceptance, and what non-production demonstration capability is actually installed?
This is a missing-record question, not a claim supported by two arbitrarily selected citations.
Status evidence as of Apr 6, 2026 · last reviewed Aug 14, 2026
Municipal records describe a small engineering/design and customer-demonstration proof of concept, not a working or large-scale AI data center. Foxconn’s later testimony says Lordstown manufactures palletized data-center components for shipment by rail and repeats that the site is not a full-scale data center. Factory expansion, substation, water, and storage infrastructure are not evidence of onsite AI compute.
What exact incremental facility and IT load is approved or installed at Lordstown, and what SoftBank/OpenAI records define its “very small percentage” of the superseded combined 1.5 GW claim without subtracting Milam’s later 1.2 GW lease?
This is a missing-record question, not a claim supported by two arbitrarily selected citations.
Status evidence as of Apr 6, 2026 · last reviewed Aug 14, 2026
Municipal records describe a small engineering/design and customer-demonstration proof of concept, not a working or large-scale AI data center. Foxconn’s later testimony says Lordstown manufactures palletized data-center components for shipment by rail and repeats that the site is not a full-scale data center. Factory expansion, substation, water, and storage infrastructure are not evidence of onsite AI compute.
What separately metered energy and water support component manufacturing, the proof-of-concept demonstration, and any future compute, without allocating factory use to model inference?
This is a missing-record question, not a claim supported by two arbitrarily selected citations.
Status evidence as of Apr 6, 2026 · last reviewed Aug 14, 2026
Municipal records describe a small engineering/design and customer-demonstration proof of concept, not a working or large-scale AI data center. Foxconn’s later testimony says Lordstown manufactures palletized data-center components for shipment by rail and repeats that the site is not a full-scale data center. Factory expansion, substation, water, and storage infrastructure are not evidence of onsite AI compute.
Which existing factory electric and water accounts, feeders, meters, and providers serve the proof of concept, and what records separate its incremental demand, withdrawals, consumption, and discharge from the wider Foxconn facility?
This is a missing-record question, not a claim supported by two arbitrarily selected citations.
Status evidence as of Jun 10, 2026 · last reviewed Sep 4, 2026
SB Energy describes the Milam campus as under construction, and state records identify registered first and second phases. Neither the accessibility filings nor tax qualification establishes commissioned compute or delivered load. SB Energy’s September 2026 S-1 lists Milam County Buildings 1 (308 MW-IT) and 2 (445 MW-IT) as under construction with last ready-for-service in 2028, names OpenAI as the customer, and states that no SB Energy data-center capacity is currently in operation; contracted MW-IT is not energized or accepted compute.
How does the 1.2 GW lease divide among Freebird buildings and the two tax-registered phases, and what facility/IT MW, service ramp, occupancy, electrical acceptance, first-billing, and compute-commissioning dates are documented?
This is a missing-record question, not a claim supported by two arbitrarily selected citations.
Status evidence as of Jun 10, 2026 · last reviewed Sep 4, 2026
SB Energy describes the Milam campus as under construction, and state records identify registered first and second phases. Neither the accessibility filings nor tax qualification establishes commissioned compute or delivered load. SB Energy’s September 2026 S-1 lists Milam County Buildings 1 (308 MW-IT) and 2 (445 MW-IT) as under construction with last ready-for-service in 2028, names OpenAI as the customer, and states that no SB Energy data-center capacity is currently in operation; contracted MW-IT is not energized or accepted compute.
Which Milam building reaches ready-for-service, utility energization, and rent commencement first, and what interval load and accelerator acceptance records accompany it?
This is a missing-record question, not a claim supported by two arbitrarily selected citations.
Status evidence as of Jun 10, 2026 · last reviewed Sep 4, 2026
SB Energy describes the Milam campus as under construction, and state records identify registered first and second phases. Neither the accessibility filings nor tax qualification establishes commissioned compute or delivered load. SB Energy’s September 2026 S-1 lists Milam County Buildings 1 (308 MW-IT) and 2 (445 MW-IT) as under construction with last ready-for-service in 2028, names OpenAI as the customer, and states that no SB Energy data-center capacity is currently in operation; contracted MW-IT is not energized or accepted compute.
Which named generation and storage entities, technologies, MW/MWh, permits, interconnections, fuel or PPA contracts, lenders, financing-close dates, and service milestones apply to Milam rather than SB Energy’s separate Google-anchored Orion solar portfolio?
This is a missing-record question, not a claim supported by two arbitrarily selected citations.
Status evidence as of Jun 10, 2026 · last reviewed Sep 4, 2026
SB Energy describes the Milam campus as under construction, and state records identify registered first and second phases. Neither the accessibility filings nor tax qualification establishes commissioned compute or delivered load. SB Energy’s September 2026 S-1 lists Milam County Buildings 1 (308 MW-IT) and 2 (445 MW-IT) as under construction with last ready-for-service in 2028, names OpenAI as the customer, and states that no SB Energy data-center capacity is currently in operation; contracted MW-IT is not energized or accepted compute.
Which water source, rights holder, utility, well or service agreement, cooling architecture, design-day/annual limit, wastewater path, and post-commissioning meter record applies to each Milam phase?
This is a missing-record question, not a claim supported by two arbitrarily selected citations.
Status evidence as of Jun 12, 2026 · last reviewed Sep 4, 2026
Wisconsin DNR describes the four-building Lighthouse campus as under construction. No energized compute, operating load, or delivered accelerator phase is claimed. Vantage refers to the development as its Lighthouse data center campus and, with Oracle and OpenAI, funded local community projects in August 2026; naming and community funding do not establish construction progress or energization.
What enforceable municipal water, sewer, and temporary-well limits apply specifically to WI11–WI14, and what do future meter records show?
This is a missing-record question, not a claim supported by two arbitrarily selected citations.
Status evidence as of Jun 12, 2026 · last reviewed Sep 4, 2026
Wisconsin DNR describes the four-building Lighthouse campus as under construction. No energized compute, operating load, or delivered accelerator phase is claimed. Vantage refers to the development as its Lighthouse data center campus and, with Oracle and OpenAI, funded local community projects in August 2026; naming and community funding do not establish construction progress or energization.
What load ramp, minimum-billing demand, service dates, and conditions appear in the redacted Port-specific VLC/Bespoke service agreements?
This is a missing-record question, not a claim supported by two arbitrarily selected citations.
Status evidence as of Jun 12, 2026 · last reviewed Sep 4, 2026
Wisconsin DNR describes the four-building Lighthouse campus as under construction. No energized compute, operating load, or delivered accelerator phase is claimed. Vantage refers to the development as its Lighthouse data center campus and, with Oracle and OpenAI, funded local community projects in August 2026; naming and community funding do not establish construction progress or energization.
What site-bound accelerator vendor, model, rack, and quantity has been ordered, delivered, installed, or accepted for each of WI11–WI14?
This is a missing-record question, not a claim supported by two arbitrarily selected citations.
Status evidence as of Jun 1, 2026 · last reviewed Aug 15, 2026
OpenAI announced a groundbreaking after township records documented foundations, utilities, and construction activity. No energized compute phase is claimed. The Attorney General sought rehearing, MPSC denied it, and an appeal followed. No reviewed source establishes a stay, vacatur or final reversal, so litigation does not suspend the approved-contract or construction status.
What appellate docket, stay order or final opinion changes the current effect of the MPSC approval?
This is a missing-record question, not a claim supported by two arbitrarily selected citations.
Status evidence as of Jun 1, 2026 · last reviewed Aug 15, 2026
OpenAI announced a groundbreaking after township records documented foundations, utilities, and construction activity. No energized compute phase is claimed. The Attorney General sought rehearing, MPSC denied it, and an appeal followed. No reviewed source establishes a stay, vacatur or final reversal, so litigation does not suspend the approved-contract or construction status.
What are actual hourly campus load, storage dispatch, and delivered generation mix, and how is the U-21990 appeal resolved?
This is a missing-record question, not a claim supported by two arbitrarily selected citations.
Status evidence as of Jun 1, 2026 · last reviewed Aug 15, 2026
OpenAI announced a groundbreaking after township records documented foundations, utilities, and construction activity. No energized compute phase is claimed. The Attorney General sought rehearing, MPSC denied it, and an appeal followed. No reviewed source establishes a stay, vacatur or final reversal, so litigation does not suspend the approved-contract or construction status.
What do operating meters show for monthly well withdrawal, consumption, hauled cooling-system waste, and sanitary discharge after commissioning?
This is a missing-record question, not a claim supported by two arbitrarily selected citations.
Status evidence as of Jun 1, 2026 · last reviewed Aug 15, 2026
OpenAI announced a groundbreaking after township records documented foundations, utilities, and construction activity. No energized compute phase is claimed. The Attorney General sought rehearing, MPSC denied it, and an appeal followed. No reviewed source establishes a stay, vacatur or final reversal, so litigation does not suspend the approved-contract or construction status.
Which named models and accelerator SKUs will be allocated to each phase, and when will a compute phase be energized?
This is a missing-record question, not a claim supported by two arbitrarily selected citations.
Status evidence as of Jun 29, 2026 · last reviewed Sep 4, 2026
Vantage says Frontier construction began in 2025, and a 2026 state accessibility registration documents the first building’s applicant schedule. Neither source establishes completion, energization, or operating compute.
For TX301–TX310 and ABI-1, which building, fire, electrical, occupancy, generator construction/operation, grid-service, and compute-acceptance records show actual phase dates and MW rather than applicant targets or design envelopes?
This is a missing-record question, not a claim supported by two arbitrarily selected citations.
Status evidence as of Jun 29, 2026 · last reviewed Sep 4, 2026
Vantage says Frontier construction began in 2025, and a 2026 state accessibility registration documents the first building’s applicant schedule. Neither source establishes completion, energization, or operating compute.
Which site-bound accelerator vendor, SKU, rack and chip quantity, delivery/acceptance date, and named training or inference workload applies to each of TX301–TX310?
This is a missing-record question, not a claim supported by two arbitrarily selected citations.
Status evidence as of Jun 29, 2026 · last reviewed Sep 4, 2026
Vantage says Frontier construction began in 2025, and a 2026 state accessibility registration documents the first building’s applicant schedule. Neither source establishes completion, energization, or operating compute.
Who are Frontier’s TDSP/TSP, REP/LSE, QSE, gas and water suppliers, and what do interconnection, dispatch, net-import/export, water-service, withdrawal, meter, and discharge records show?
This is a missing-record question, not a claim supported by two arbitrarily selected citations.
Applied Digital Polaris Forge 1 — Ellendale (CoreWeave)
Status evidence as of Jul 1, 2026 · last reviewed Sep 4, 2026
Applied Digital reports Building 1 (100 MW) reached Ready for Service in two 50 MW phases in October and November 2025 and Building 2 Phase 1 (75 MW) on June 30, 2026, bringing live capacity to 175 MW of the 400 MW leased to CoreWeave under roughly 15-year agreements, with Building 4 (150 MW) financed and under construction. Montana-Dakota Utilities says it currently serves the campus. Landlord ready-for-service and energized capacity are not tenant production compute, chip counts, or workloads.
What do the Montana-Dakota service agreement and interval metering show for facility load versus contracted MW, and which regional generation serves it?
This is a missing-record question, not a claim supported by two arbitrarily selected citations.
Applied Digital Polaris Forge 1 — Ellendale (CoreWeave)
Status evidence as of Jul 1, 2026 · last reviewed Sep 4, 2026
Applied Digital reports Building 1 (100 MW) reached Ready for Service in two 50 MW phases in October and November 2025 and Building 2 Phase 1 (75 MW) on June 30, 2026, bringing live capacity to 175 MW of the 400 MW leased to CoreWeave under roughly 15-year agreements, with Building 4 (150 MW) financed and under construction. Montana-Dakota Utilities says it currently serves the campus. Landlord ready-for-service and energized capacity are not tenant production compute, chip counts, or workloads.
When do Building 2 Phase 2, Building 3, and Building 4 reach ready-for-service, and does the Building 4 lease assignment to CoreWeave close?
This is a missing-record question, not a claim supported by two arbitrarily selected citations.
Applied Digital Polaris Forge 1 — Ellendale (CoreWeave)
Status evidence as of Jul 1, 2026 · last reviewed Sep 4, 2026
Applied Digital reports Building 1 (100 MW) reached Ready for Service in two 50 MW phases in October and November 2025 and Building 2 Phase 1 (75 MW) on June 30, 2026, bringing live capacity to 175 MW of the 400 MW leased to CoreWeave under roughly 15-year agreements, with Building 4 (150 MW) financed and under construction. Montana-Dakota Utilities says it currently serves the campus. Landlord ready-for-service and energized capacity are not tenant production compute, chip counts, or workloads.
Which CoreWeave workloads, accelerator models, and quantities occupy the ready-for-service halls, and when did tenant production begin?
This is a missing-record question, not a claim supported by two arbitrarily selected citations.
Status evidence as of Apr 29, 2026 · last reviewed Sep 4, 2026
Crusoe says two 100 MW buildings were energized by March 27; Lancium’s CEO described three buildings as running full out on April 9; and OpenAI confirms GB200 systems are running. These milestones do not disclose meter demand or live critical-IT megawatts.
What are the per-building critical-IT megawatts, average and peak meter demand, installed GB200 rack count, and installed superchip or GPU count?
This is a missing-record question, not a claim supported by two arbitrarily selected citations.
Status evidence as of Apr 29, 2026 · last reviewed Sep 4, 2026
Crusoe says two 100 MW buildings were energized by March 27; Lancium’s CEO described three buildings as running full out on April 9; and OpenAI confirms GB200 systems are running. These milestones do not disclose meter demand or live critical-IT megawatts.
What do the municipal meter records show for potable, raw, reclaimed, cooling, domestic, and construction water separately?
This is a missing-record question, not a claim supported by two arbitrarily selected citations.
Status evidence as of Apr 29, 2026 · last reviewed Sep 4, 2026
Crusoe says two 100 MW buildings were energized by March 27; Lancium’s CEO described three buildings as running full out on April 9; and OpenAI confirms GB200 systems are running. These milestones do not disclose meter demand or live critical-IT megawatts.
Who are the REP/LSE and QSE, and what are interval net imports, exports, on-site-generation netting, and monthly energy and peak demand?
This is a missing-record question, not a claim supported by two arbitrarily selected citations.
Status evidence as of Jun 5, 2026 · last reviewed Sep 4, 2026
Two company-reported clusters are online: approximately 110,000 GB200 and 110,000 GB300 GPUs totaling about 430 MW of compute. The next at-least-220,000-GB300 phase remains future.
Has the next at-least-220,000-GB300 phase been commissioned since the June 2026 filing?
This is a missing-record question, not a claim supported by two arbitrarily selected citations.
Status evidence as of Jun 5, 2026 · last reviewed Sep 4, 2026
Two company-reported clusters are online: approximately 110,000 GB200 and 110,000 GB300 GPUs totaling about 430 MW of compute. The next at-least-220,000-GB300 phase remains future.
What are post-commissioning potable-water meter reads, and has any recycled water been delivered?
This is a missing-record question, not a claim supported by two arbitrarily selected citations.
Status evidence as of Jun 5, 2026 · last reviewed Sep 4, 2026
Two company-reported clusters are online: approximately 110,000 GB200 and 110,000 GB300 GPUs totaling about 430 MW of compute. The next at-least-220,000-GB300 phase remains future.
Which mobile turbines are operating now, has any permitted stationary unit been construction-certified, and what is hourly dispatch?
This is a missing-record question, not a claim supported by two arbitrarily selected citations.
Status evidence as of Aug 14, 2026 · last reviewed Sep 4, 2026
SpaceXAI reports more than 220,000 installed H100, H200, and GB200 GPUs. MLGW documented 150 MW of energized grid service; actual grid, on-site generation, and workload shares remain undisclosed.
Can the underlying MLGW potable-water bills and any recycled-water meter or delivery records be obtained?
This is a missing-record question, not a claim supported by two arbitrarily selected citations.
Status evidence as of Aug 14, 2026 · last reviewed Sep 4, 2026
SpaceXAI reports more than 220,000 installed H100, H200, and GB200 GPUs. MLGW documented 150 MW of energized grid service; actual grid, on-site generation, and workload shares remain undisclosed.
What is actual hourly load by grid, on-site generation, battery discharge, training, and inference?
This is a missing-record question, not a claim supported by two arbitrarily selected citations.
Status evidence as of Aug 14, 2026 · last reviewed Sep 4, 2026
SpaceXAI reports more than 220,000 installed H100, H200, and GB200 GPUs. MLGW documented 150 MW of energized grid service; actual grid, on-site generation, and workload shares remain undisclosed.
Which later Grok variants used Colossus 1, and what current capacity is allocated to Anthropic?
This is a missing-record question, not a claim supported by two arbitrarily selected citations.
Deutsche Telekom Industrial AI Cloud — Munich Tucherpark
Status evidence as of Feb 4, 2026 · last reviewed Sep 4, 2026
Deutsche Telekom announced the Munich AI factory in November 2025 and said it officially went into operation on February 4, 2026 at Tucherpark in a renovated former bank data center of about 10,700 m² with nearly 10,000 NVIDIA Blackwell GPUs, operating at over a third of capacity with named customers. Company utilisation and inventory statements are not independent acceptance records, and no MW is disclosed.
How many DGX B200 systems and RTX PRO servers are installed and accepted, and which customer workloads run on them?
This is a missing-record question, not a claim supported by two arbitrarily selected citations.
Deutsche Telekom Industrial AI Cloud — Munich Tucherpark
Status evidence as of Feb 4, 2026 · last reviewed Sep 4, 2026
Deutsche Telekom announced the Munich AI factory in November 2025 and said it officially went into operation on February 4, 2026 at Tucherpark in a renovated former bank data center of about 10,700 m² with nearly 10,000 NVIDIA Blackwell GPUs, operating at over a third of capacity with named customers. Company utilisation and inventory statements are not independent acceptance records, and no MW is disclosed.
What Eisbach water-use permit, flow, and temperature conditions apply, and how much heat is delivered to the district network?
This is a missing-record question, not a claim supported by two arbitrarily selected citations.
Deutsche Telekom Industrial AI Cloud — Munich Tucherpark
Status evidence as of Feb 4, 2026 · last reviewed Sep 4, 2026
Deutsche Telekom announced the Munich AI factory in November 2025 and said it officially went into operation on February 4, 2026 at Tucherpark in a renovated former bank data center of about 10,700 m² with nearly 10,000 NVIDIA Blackwell GPUs, operating at over a third of capacity with named customers. Company utilisation and inventory statements are not independent acceptance records, and no MW is disclosed.
What are the facility’s electrical capacity, supplier, and metered load, and who holds the electricity account?
This is a missing-record question, not a claim supported by two arbitrarily selected citations.
Status evidence as of Jun 23, 2026 · last reviewed Aug 14, 2026
Microsoft says the first MKE03/04 facility is fully operational after equipment startup began in April 2026. A second adjacent, similar-scale facility remains under construction for scheduled completion in 2028.
What do the nonconfidential utility service agreement, ramp schedule, meters, and monthly intervals show for each Fairwater phase?
This is a missing-record question, not a claim supported by two arbitrarily selected citations.
Status evidence as of Jun 23, 2026 · last reviewed Aug 14, 2026
Microsoft says the first MKE03/04 facility is fully operational after equipment startup began in April 2026. A second adjacent, similar-scale facility remains under construction for scheduled completion in 2028.
Which models and workload shares run in the operational building, and how many GB200 systems are installed, energized, accepted, and usable?
This is a missing-record question, not a claim supported by two arbitrarily selected citations.
Status evidence as of Jun 23, 2026 · last reviewed Aug 14, 2026
Microsoft says the first MKE03/04 facility is fully operational after equipment startup began in April 2026. A second adjacent, similar-scale facility remains under construction for scheduled completion in 2028.
Which water accounts serve each phase, and what are measured withdrawal, consumption, discharge, source, and peak-day totals?
This is a missing-record question, not a claim supported by two arbitrarily selected citations.
Status evidence as of Jun 22, 2026 · last reviewed Aug 15, 2026
The City of Hamina describes the campus as operating since 2011 and confirms that recovered cooling heat is now routed to the district network. Conceptual EIA expansion buildings are not treated as commissioned. A January 2026 temporary environmental permit covers rock crushing and earthworks at expansion property only; it does not establish an expansion building, energization or compute.
What are Hamina’s metered facility and IT power ratings, electricity seller and grid connections, and hourly carbon-free-energy accounting boundaries?
This is a missing-record question, not a claim supported by two arbitrarily selected citations.
Status evidence as of Jun 22, 2026 · last reviewed Aug 15, 2026
The City of Hamina describes the campus as operating since 2011 and confirms that recovered cooling heat is now routed to the district network. Conceptual EIA expansion buildings are not treated as commissioned. A January 2026 temporary environmental permit covers rock crushing and earthworks at expansion property only; it does not establish an expansion building, energization or compute.
What are Hamina’s permitted and measured seawater withdrawals, consumptive losses and returns by cooling mode, and actual recovered-heat delivery?
This is a missing-record question, not a claim supported by two arbitrarily selected citations.
Status evidence as of Jun 22, 2026 · last reviewed Aug 15, 2026
The City of Hamina describes the campus as operating since 2011 and confirms that recovered cooling heat is now routed to the district network. Conceptual EIA expansion buildings are not treated as commissioned. A January 2026 temporary environmental permit covers rock crushing and earthworks at expansion property only; it does not establish an expansion building, energization or compute.
Which expansion building permits, occupancy approvals and first-load records follow the temporary earthworks permit?
This is a missing-record question, not a claim supported by two arbitrarily selected citations.
Status evidence as of Jun 22, 2026 · last reviewed Aug 15, 2026
The City of Hamina describes the campus as operating since 2011 and confirms that recovered cooling heat is now routed to the district network. Conceptual EIA expansion buildings are not treated as commissioned. A January 2026 temporary environmental permit covers rock crushing and earthworks at expansion property only; it does not establish an expansion building, energization or compute.
Which named AI models, accelerator products, quantities, and workload shares are physically allocated to Hamina rather than merely available in the Finland region?
This is a missing-record question, not a claim supported by two arbitrarily selected citations.
Status evidence as of Mar 31, 2026 · last reviewed Aug 15, 2026
Google reports the campus operating, hosting the Santiago Google Cloud region, and publishes 2024 environmental metrics. Historical PARAM expansion and fuel-storage records add permit lineage but do not establish current generator operation, cooling topology or AI workload allocation.
How much water is withdrawn versus consumed, by cooling mode and season?
This is a missing-record question, not a claim supported by two arbitrarily selected citations.
Status evidence as of Mar 31, 2026 · last reviewed Aug 15, 2026
Google reports the campus operating, hosting the Santiago Google Cloud region, and publishes 2024 environmental metrics. Historical PARAM expansion and fuel-storage records add permit lineage but do not establish current generator operation, cooling topology or AI workload allocation.
What current Dataluna/Google permit and inspection records establish generator inventory, fuel use and expansion status?
This is a missing-record question, not a claim supported by two arbitrarily selected citations.
Status evidence as of Mar 31, 2026 · last reviewed Aug 15, 2026
Google reports the campus operating, hosting the Santiago Google Cloud region, and publishes 2024 environmental metrics. Historical PARAM expansion and fuel-storage records add permit lineage but do not establish current generator operation, cooling topology or AI workload allocation.
Which chip generations and AI workloads are physically allocated to Quilicura?
This is a missing-record question, not a claim supported by two arbitrarily selected citations.
Status evidence as of Mar 31, 2026 · last reviewed Aug 15, 2026
Google reports the campus operating, hosting the Santiago Google Cloud region, and publishes 2024 environmental metrics. Historical PARAM expansion and fuel-storage records add permit lineage but do not establish current generator operation, cooling topology or AI workload allocation.
Which legal relationship connects Dataluna to Google, who supplies electricity, and what is the residual hourly generation mix?
This is a missing-record question, not a claim supported by two arbitrarily selected citations.
Status evidence as of Sep 16, 2025 · last reviewed Sep 4, 2026
Google announced the $1 billion data centre on a 33-acre Waltham Cross site in January 2024 and opened it on September 16, 2025. Reporting from a July 2026 community meeting says the site is nowhere near an expected 77 MW at full build-out and records resident noise and lighting complaints. An opened facility is not a fully built or fully loaded campus, and the £5 billion programme is not a site figure.
Has any off-site heat-recovery connection been built and delivered?
This is a missing-record question, not a claim supported by two arbitrarily selected citations.
Status evidence as of Sep 16, 2025 · last reviewed Sep 4, 2026
Google announced the $1 billion data centre on a 33-acre Waltham Cross site in January 2024 and opened it on September 16, 2025. Reporting from a July 2026 community meeting says the site is nowhere near an expected 77 MW at full build-out and records resident noise and lighting complaints. An opened facility is not a fully built or fully loaded campus, and the £5 billion programme is not a site figure.
What are the site’s permitted and energized electrical capacity, current interval load, and supplier and meter records?
This is a missing-record question, not a claim supported by two arbitrarily selected citations.
Status evidence as of Sep 16, 2025 · last reviewed Sep 4, 2026
Google announced the $1 billion data centre on a 33-acre Waltham Cross site in January 2024 and opened it on September 16, 2025. Reporting from a July 2026 community meeting says the site is nowhere near an expected 77 MW at full build-out and records resident noise and lighting complaints. An opened facility is not a fully built or fully loaded campus, and the £5 billion programme is not a site figure.
Which planning conditions on noise and lighting apply, and what post-opening acoustic and lighting measurements exist?
This is a missing-record question, not a claim supported by two arbitrarily selected citations.
Status evidence as of Aug 20, 2025 · last reviewed Aug 15, 2026
Meta says the Kansas City data center began serving traffic on August 20, 2025. The same source describes operational jobs only once the campus is completed, so the live phase is not treated as full campus buildout. City planning and warning-siren ordinances corroborate the named physical project but do not independently establish operation.
What measured load, water quantities, chip inventory and product/model allocation applies to each live phase, and which Evergy legal entity and service boundary serve it?
This is a missing-record question, not a claim supported by two arbitrarily selected citations.
Status evidence as of Aug 20, 2025 · last reviewed Aug 15, 2026
Meta says the Kansas City data center began serving traffic on August 20, 2025. The same source describes operational jobs only once the campus is completed, so the live phase is not treated as full campus buildout. City planning and warning-siren ordinances corroborate the named physical project but do not independently establish operation.
Which buildings and phases are serving traffic, and when will the full campus be completed?
This is a missing-record question, not a claim supported by two arbitrarily selected citations.
Status evidence as of Sep 3, 2026 · last reviewed Sep 4, 2026
Meta says the Kuna Data Center is online and operational as of September 3, 2026, after breaking ground in 2022 with more than $1.2 billion invested. The info sheet describes about 100 operational jobs once completed, so an operating phase is not treated as a completed campus, a measured load, or an AI workload allocation.
What product, model, and accelerator allocation, if any, is site-bound at Kuna, and what does the first sustainability report disclose for water and energy?
This is a missing-record question, not a claim supported by two arbitrarily selected citations.
Status evidence as of Sep 3, 2026 · last reviewed Sep 4, 2026
Meta says the Kuna Data Center is online and operational as of September 3, 2026, after breaking ground in 2022 with more than $1.2 billion invested. The info sheet describes about 100 operational jobs once completed, so an operating phase is not treated as a completed campus, a measured load, or an AI workload allocation.
Which buildings are serving traffic, what is the metered load, and when is full buildout complete?
This is a missing-record question, not a claim supported by two arbitrarily selected citations.
Status evidence as of Jan 30, 2025 · last reviewed Aug 15, 2026
Meta says the Mesa data center began serving traffic on January 30, 2025. The same source describes more than $1 billion only at full buildout, so an operating phase is not treated as a completed campus.
What measured load, water, chip inventory and product/model allocation applies to each live phase?
This is a missing-record question, not a claim supported by two arbitrarily selected citations.
Status evidence as of Jan 30, 2025 · last reviewed Aug 15, 2026
Meta says the Mesa data center began serving traffic on January 30, 2025. The same source describes more than $1 billion only at full buildout, so an operating phase is not treated as a completed campus.
Which buildings and phases are serving traffic and when will full buildout be complete?
This is a missing-record question, not a claim supported by two arbitrarily selected citations.
Status evidence as of Nov 12, 2025 · last reviewed Sep 4, 2026
Microsoft says the Atlanta Fairwater site began operating in October 2025 and is joined to the Wisconsin Fairwater site by a dedicated AI WAN. Microsoft names only the metro; AJC records reporting places the facility inside a 615-acre QTS-developed campus in Fayetteville, and Fayette County describes QTS campus water service. An operating first facility is not a completed campus, a measured load, a chip count, or a workload allocation.
What do county meters show for operating rather than construction water consumption at the Fairwater buildings, and which service lines feed them?
This is a missing-record question, not a claim supported by two arbitrarily selected citations.
Status evidence as of Nov 12, 2025 · last reviewed Sep 4, 2026
Microsoft says the Atlanta Fairwater site began operating in October 2025 and is joined to the Wisconsin Fairwater site by a dedicated AI WAN. Microsoft names only the metro; AJC records reporting places the facility inside a 615-acre QTS-developed campus in Fayetteville, and Fayette County describes QTS campus water service. An operating first facility is not a completed campus, a measured load, a chip count, or a workload allocation.
Which QTS buildings, MW, and GPU counts does Microsoft actually occupy, and what interval load does the Georgia Power account show?
This is a missing-record question, not a claim supported by two arbitrarily selected citations.
Status evidence as of Jul 9, 2026 · last reviewed Aug 15, 2026
AWS calls multi-site Project Rainier fully operational and identifies St. Joseph County as one site; a July 2026 company-authored local update describes the New Carlisle campus as serving customers, but neither source itemizes the Indiana share of Rainier compute. IDEM separately defines SBN100 at 55001 Larrison Boulevard and SBN201 at Western/Larrison as stationary sources under common Amazon ownership. DHS variance records for named buildings are code scopes, not occupancy or compute.
How many Trainium2 chips and which Claude workloads, if any, are allocated to St. Joseph County?
This is a missing-record question, not a claim supported by two arbitrarily selected citations.
Status evidence as of Jul 9, 2026 · last reviewed Aug 15, 2026
AWS calls multi-site Project Rainier fully operational and identifies St. Joseph County as one site; a July 2026 company-authored local update describes the New Carlisle campus as serving customers, but neither source itemizes the Indiana share of Rainier compute. IDEM separately defines SBN100 at 55001 Larrison Boulevard and SBN201 at Western/Larrison as stationary sources under common Amazon ownership. DHS variance records for named buildings are code scopes, not occupancy or compute.
Request from IURC and Indiana Michigan Power the non-confidential interval demand and energy series, energization dates, and substation or balancing-area identifiers for the New Carlisle AWS campus, and from New Carlisle or South Bend the water-use records and permit file associated with document ID 389839.
This is a missing-record question, not a claim supported by two arbitrarily selected citations.
Status evidence as of Jul 9, 2026 · last reviewed Aug 15, 2026
AWS calls multi-site Project Rainier fully operational and identifies St. Joseph County as one site; a July 2026 company-authored local update describes the New Carlisle campus as serving customers, but neither source itemizes the Indiana share of Rainier compute. IDEM separately defines SBN100 at 55001 Larrison Boulevard and SBN201 at Western/Larrison as stationary sources under common Amazon ownership. DHS variance records for named buildings are code scopes, not occupancy or compute.
Which final IDEM modification, occupancy and equipment-acceptance records map SBN100/SBN201 and named buildings to actual operating phases?
This is a missing-record question, not a claim supported by two arbitrarily selected citations.
Status evidence as of Jul 9, 2026 · last reviewed Aug 15, 2026
AWS calls multi-site Project Rainier fully operational and identifies St. Joseph County as one site; a July 2026 company-authored local update describes the New Carlisle campus as serving customers, but neither source itemizes the Indiana share of Rainier compute. IDEM separately defines SBN100 at 55001 Larrison Boulevard and SBN201 at Western/Larrison as stationary sources under common Amazon ownership. DHS variance records for named buildings are code scopes, not occupancy or compute.
Which other facilities does AWS officially include in Rainier, beyond secondary reporting about Mississippi and possible North Carolina and Pennsylvania sites?
This is a missing-record question, not a claim supported by two arbitrarily selected citations.
Status evidence as of May 5, 2026 · last reviewed Sep 4, 2026
Start Campus reports an official opening of SIN01 and describes it as fully leased, and Nscale’s May 2026 release says its expanded agreement builds on the deployment of over 12,600 Blackwell Ultra GPUs at the first building for Microsoft. Those company statements support an operating first building; they do not establish measured load, accepted GPU inventory, or workload allocation. The second 200 MW building and the 66,000+ Rubin GPUs are future commitments and do not promote any later phase.
What acceptance, energization, and utilisation records show how many of the reported 12,600 GB300 GPUs are installed and serving Microsoft workloads at SIN01?
This is a missing-record question, not a claim supported by two arbitrarily selected citations.
Status evidence as of May 5, 2026 · last reviewed Sep 4, 2026
Start Campus reports an official opening of SIN01 and describes it as fully leased, and Nscale’s May 2026 release says its expanded agreement builds on the deployment of over 12,600 Blackwell Ultra GPUs at the first building for Microsoft. Those company statements support an operating first building; they do not establish measured load, accepted GPU inventory, or workload allocation. The second 200 MW building and the 66,000+ Rubin GPUs are future commitments and do not promote any later phase.
What are SIN01’s metered IT load, seawater intake and discharge volumes, and any cooling-tower make-up water use?
This is a missing-record question, not a claim supported by two arbitrarily selected citations.
Status evidence as of May 5, 2026 · last reviewed Sep 4, 2026
Start Campus reports an official opening of SIN01 and describes it as fully leased, and Nscale’s May 2026 release says its expanded agreement builds on the deployment of over 12,600 Blackwell Ultra GPUs at the first building for Microsoft. Those company statements support an operating first building; they do not establish measured load, accepted GPU inventory, or workload allocation. The second 200 MW building and the 66,000+ Rubin GPUs are future commitments and do not promote any later phase.
Which permits, construction records, and grid-connection agreements apply to the second 200 MW building, and how does it reconcile with the 180 MW SIN02 described by the company?
This is a missing-record question, not a claim supported by two arbitrarily selected citations.
Status evidence as of Oct 31, 2025 · last reviewed Sep 4, 2026
YTL Power announced on October 31, 2025 the completion of its AI data centre facility at the 600 MW YTL Green Data Center Park in Kulai with liquid-cooled GB200 NVL72 hardware and said YTL AI Cloud is now operational, corroborated by Malaysian press reporting the Prime Minister’s statement. Completion of one AI facility does not establish the park’s build-out, the facility’s MW, a GPU count, or metered load.
What heat-rejection system and water source apply, and what withdrawal or consumption is recorded?
This is a missing-record question, not a claim supported by two arbitrarily selected citations.
Status evidence as of Oct 31, 2025 · last reviewed Sep 4, 2026
YTL Power announced on October 31, 2025 the completion of its AI data centre facility at the 600 MW YTL Green Data Center Park in Kulai with liquid-cooled GB200 NVL72 hardware and said YTL AI Cloud is now operational, corroborated by Malaysian press reporting the Prime Minister’s statement. Completion of one AI facility does not establish the park’s build-out, the facility’s MW, a GPU count, or metered load.
What is the completed AI facility’s IT capacity, GB200 NVL72 rack count, and metered load?
This is a missing-record question, not a claim supported by two arbitrarily selected citations.
Status evidence as of Oct 31, 2025 · last reviewed Sep 4, 2026
YTL Power announced on October 31, 2025 the completion of its AI data centre facility at the 600 MW YTL Green Data Center Park in Kulai with liquid-cooled GB200 NVL72 hardware and said YTL AI Cloud is now operational, corroborated by Malaysian press reporting the Prime Minister’s statement. Completion of one AI facility does not establish the park’s build-out, the facility’s MW, a GPU count, or metered load.
Which electricity supplier, grid connection, and solar-plant contracts serve the facility, and how much energy is matched versus physically delivered?
This is a missing-record question, not a claim supported by two arbitrarily selected citations.
The atlas is maintained in research batches. The September 4, 2026 pass took it from 42 campuses in nine countries to 71 in eighteen, and every site now carries an electricity context, either a dated regional proxy or an explicit note that no grid record supports one. The batch identifiers in the downloadable bundle say which pass added or deepened each record.
Which are the largest?
There is no defensible single list unless the denominator is fixed.
Meta describes Hyperion as an eventual 5 gigawatt compute buildout. Vantage describes Frontier as a planned 1.4 gigawatt critical IT load. Abilene's 1.2 gigawatts describes full-campus total power capacity, with only part of the campus live at the cited date. xAI reports more than 220,000 installed GPUs at Colossus 1. AWS describes nearly 500,000 Trainium2 chips across multiple U.S. data centers in Project Rainier.
Those facts are significant and incompatible. A planned campus, current draw, critical IT load, total service, installed accelerator count, distributed cluster, lease, and hardware description should never be silently sorted in one column.
“Largest” has no single denominator
A gigawatt, a GPU count, and a lease are not one ranking
Filter to compare a compatible disclosure basis. The unfiltered view is an evidence inventory, not a sorted leaderboard.
campus compute buildout
Hyperion
Richland Parish, Louisiana · Meta
under construction
5 GW
Eventual full-campus compute capacity
Boundary: Planned buildout—not present electricity draw or operating IT load.
Berkeley Lab's 2026 Queued Up analysis counted more than 2,060 GW of generation and storage capacity seeking U.S. grid connection at the end of 2025. Those are supply-side projects, not a queue of data centers. Many proposed projects withdraw before operation.
A campus therefore needs two separate investigations: whether its load can connect and whether the generation and network upgrades it depends on will arrive. A large national queue cannot tell a neighbor when one substation will energize, or who will pay if a campus fails to materialize.
Communities bear the local costs
Opposition is not one argument. A project can concentrate continuous sound, peak-day water demand, transmission lines, backup-engine emissions, industrial buildings, road traffic, tax incentives, and utility investment while creating far fewer permanent jobs than construction jobs. Benefits and burdens can coexist.
Scale also moves risk between parties. If a utility builds generation or transmission for a forecast load that arrives late, never arrives, or leaves early, who pays? If a site is dry cooled, what happens to its electricity demand during a heat wave? If it uses reclaimed water, where does blowdown go? If a generator permit allows thousands of hours, how many hours actually occur? If a sound study models the first phase, what happens when all phases run simultaneously?
No single permit answers all of those questions. Local government controls land use, setbacks, roads, buildings, and often noise. Water and sewer authorities control service and discharge. Air agencies permit engines or turbines. Utility commissions decide tariffs, contracts, and cost recovery. Utilities, regional grid organizations, and FERC address interconnection and transmission under different jurisdictions.
The permit stack
No single regulator can answer “is this data center approved?”
Land, electricity, air, water, wastewater, wetlands, roads, taxes, and construction can move on different calendars. Select an authority to see what it can—and cannot—decide.
Selected authority
Local government
enacted
Can decide
Rezoning, special-exception, or special-use approval
Site plan, building, fire, roads
Local noise, setbacks, landscaping
Does not prove or control
It usually does not dispatch the grid or set interstate wholesale transmission rules.
Current example
Effective July 1, 2026, Virginia requires a sound-profile assessment for a new ≥100 MW high-energy-use facility seeking rezoning, special-exception, or special-use approval; the statute has an exemption for certain previously approved sites and smaller expansions.
Each mitigation fixes a boundary—not “the data center.”
Noise
Constant low-frequency or tonal sound, especially at night.
Useful response
Baseline and post-opening spectral measurement, tonal penalties, setbacks, barriers, equipment schedules, and a public complaint log.
Limit: Acoustic controls do not solve power, water, or land impacts.
Water
Peak-day and drought demand can matter locally even when statewide share looks small.
Useful response
Monthly and peak metering by source, reclaimed-water infrastructure, drought modes, dry/hybrid cooling, and public blowdown routes.
Limit: Dry cooling can increase electricity and capital; reclaimed water still needs treatment.
Power bills
Utility assets can become stranded if forecast load never arrives or leaves early.
Useful response
Long contracts, minimum bills, collateral, upfront contributions, staged ramps, curtailment, and exit charges.
Limit: These reduce risk; they do not guarantee zero regional price or transmission effects.
Air
Backup engines, bridge generation, and onsite turbines have different operating profiles.
Useful response
Equipment inventory, enforceable hour/fuel limits, aftertreatment, batteries where duration works, and actual-emissions reporting.
Limit: A permit proves an allowed envelope, not actual hours or measured compliance.
Land + jobs
Large industrial buildings, lines, roads, tax incentives, and temporary construction can reshape a place.
Useful response
Setbacks, corridors, wetlands review, enforceable hiring/community agreements, actual job reporting, and incentive clawbacks.
Limit: Benefits and impacts can coexist; one does not cancel the other.
Virginia’s unusually detailed 2024 audit · useful, not nationally universal
2.1B gal
Estimated 2023 data-center water use; just over one-third reclaimed. Less than 0.5% statewide, but 0.2%–21% of non-reclaimed demand at six reviewed utilities.
≈50 jobs
Typical full-time operations for a 250,000-square-foot building; roughly half contractors. Construction can peak near 1,500 for 12–18 months.
$14–$37/mo
Modeled 2040 generation/transmission effect for a typical Dominion residential customer—not an observed bill increase and not one campus.
$928M
Estimated FY2023 Virginia sales/use-tax revenue forgone under the data-center exemption; forgone revenue is not the same as a net fiscal loss.
The practical response is equally layered: monthly and peak water reporting; drought operating plans; dry or hybrid modes where appropriate; baseline and post-opening spectral noise tests; setbacks, barriers, and tonal limits; enforceable generator hours and emissions reporting; staged grid commitments; minimum bills, collateral, exit charges, and curtailment terms; wetlands and road review; public job reporting; and incentive clawbacks.
Each measure addresses one failure mode. None turns "the data center" into a single yes-or-no policy object.
The physical dependencies behind an AI app
You do not need to operate a chiller plant to understand the implications.
A fast answer has a physical route. Your app may depend on a model provider, cloud region, campus, network fabric, chip fleet, cooling plant, substation, utility, and fuel system owned by different organizations.
Vertical integration changes the route; it does not erase dependency. Owning the app, model, chip design, cloud, and campus still leaves fabrication, memory, packaging, utilities, construction, and regulation outside the boundary.
Water labels can invert the story. Liquid at the chip may use no routine evaporative water, while air at the server may end at a wet tower.
Efficiency and growth can happen together. A falling PUE does not guarantee falling total electricity, water, land, or grid infrastructure when compute expands faster.
Geography changes the risk. An annual corporate total cannot reveal a small utility's summer peak, a stressed watershed, a neighborhood's nighttime tone, or the generator serving a critical hour.
A project announcement is a chain of future states. Land option, permit, interconnection request, contract, construction, energization, hardware installation, acceptance, and useful workload are different milestones.
Most application-to-building allocations are not public. A provider may disclose a fleet and a product without revealing which share of requests, accelerators, electricity, or water belongs to either.
The reporter notebook
The strongest leads sit in the joins public sources do not make.
Which "liquid-cooled" campuses end at evaporative towers? How much site water is metered? What are monthly withdrawal, discharge, source type, and peak-day demand? Where do reverse-osmosis reject and cooling-tower blowdown go? Did the acoustic model include every phase at simultaneous load and examine one-third-octave bands? How much announced power is queued, contracted, energized, and actually operating? Who pays for stranded utility infrastructure? Which party is the property owner, developer, operator, tenant, cloud, workload customer, and utility counterparty? Is a GPU count tied to this campus or merely the company's portfolio?
Reporter lead desk
The unknown fields are the reporting queue
A mapped building is not a verified campus, a permit is not measured operation, and a company fleet metric is not an AI workload allocation. Every claim keeps its geography, date, denominator, evidence type, and public unknowns. Primer and ODbL census reviewed Aug 13, 2026; facility atlas and investigation reviewed Sep 4, 2026; bundle integrated Sep 4, 2026.
Which liquid-cooled projects ultimately reject heat through an evaporative tower?
02
What are monthly withdrawal, discharge, source type, and peak-day water demand?
03
How much water reporting is metered versus estimated?
04
What happens to reverse-osmosis reject and cooling-tower blowdown?
05
Does the acoustic study cover every phase at simultaneous peak load and nighttime weather?
06
Are tonal and low-frequency bands measured, or only an aggregate A-weighted number?
07
How much announced MW is queued, contracted, energized, and actually operating?
08
Who pays if a utility builds assets for load that never arrives?
09
Which party is landowner, developer, operator, tenant, utility counterparty, and workload customer?
10
Is hardware disclosed for this facility or only somewhere in the operator’s portfolio?
11
Are jobs construction, permanent operations, contractor, indirect, committed, or realized?
12
Can heat-reuse claims be matched to a nearby year-round customer and signed offtake?
Dated source ledger
469 of 469 sources
Google announces new data center in Armstrong County, TexasABC7 Amarillo (KVII) · published or filed Nov 24, 2025 · journalism · curated facility atlasReports about 1,300 acres near Claude, construction by Crusoe Energy since May 2025, completion expected late 2028 or early 2029, closed-loop cooling, 80–100 jobs, and the county judge’s statement that the site will draw from ERCOT although the county is in the Southwest Power Pool. Local statements are not interconnection or permit records.Original
AEP Ohio Partners to Bring $4.2B in New Electric Infrastructure in Appalachian Ohio Without Raising Customer RatesAEP Ohio · published or filed Mar 20, 2026 · utility · curated facility atlasAnnounces, with DOE and SB Energy, 765 kV transmission to serve a planned 10 GW campus at the former Piketon gaseous diffusion plant, with SB Energy committed to pay the $4.2 billion and AEP Ohio expecting power to begin flowing in 2029 subject to Ohio Power Siting Board permitting. It is a plan, not an approved line or energized service.Original
Data Center TariffAEP Ohio · retrieved Aug 14, 2026 · utility · curated facility atlasLiving tariff page retrieved August 14, 2026. It is relevant large-load context, but no reviewed Prometheus service agreement or tariff-applicability record was found.Original
Piketon Area Improvements ProjectAEP Transmission · retrieved Sep 4, 2026 · utility · curated facility atlasLiving project page retrieved September 4, 2026. It names the Baku–Gavin and Hanging Rock–Baku 765 kV projects and a feasibility study, states the work requires Ohio Power Siting Board approval, and lists no application, construction, or in-service dates.Original
Microsoft StartCampus expansion plans unveiled by NscaleAICEP Portugal Global · published or filed May 6, 2026 · government · curated facility atlasPortuguese investment-agency summary repeating the €230 million and €465 million investments, the second 200 MW building, and the 66,000+ Rubin GPU plan. It corroborates the announcement, not construction or operation of the second building.Original
ALEC Holdings International Offering MemorandumALEC Holdings · published or filed Sep 23, 2025 · filing · curated facility atlasDiscloses the June 5, 2025 pre-construction agreement between G42 Sky5 Technological Projects LLC and ALEC Construction for SG1 and distinguishes that work from the then-negotiated follow-on EPC scope.Original
ALEC Holdings Integrated Annual Report 2025ALEC Holdings via Dubai Financial Market · published or filed Mar 13, 2026 · filing · curated facility atlasCalls the 200 MW phase under construction, identifies Khazna as client and ALEC group delivery roles, and describes liquid and immersion cooling. Its phased-commissioning language describes the delivery approach and is not a dated acceptance or energization record.Original
AMD, Cisco and HUMAIN expand Saudi Arabia’s AI infrastructure as AMD Instinct systems go liveAMD · published or filed Aug 31, 2026 · company · curated facility atlasSays MI355X-based infrastructure with Cisco networking is live in Saudi Arabia and serving HUMAIN customers, that up to 250 MW of MI400-based capacity is planned from 2027, and that the venture targets up to 1 GW by 2030. It names no city, building, GPU count, or MW for the live cluster.Original
Memphis mayor says xAI wastewater facility construction will resume by 2027Action News 5 · published or filed Jun 23, 2026 · journalism · curated facility atlasReports the mayor’s later schedule statement; it supports neither commissioning nor a facility-specific recycled-water allocation.Original
Adani and Google partner to build India’s largest data centre campus in VisakhapatnamAdani Group · published or filed Oct 14, 2025 · company · curated facility atlasIdentifies AdaniConneX (a 50:50 Adani Enterprises–EdgeConneX venture) as developer of purpose-built AI data-centre infrastructure and describes transmission, clean-generation, and storage intentions. It does not disclose MW, ownership of buildings, or a commissioning date.Original
Form 8-K — Meta strategic arrangementAdvanced Micro Devices, Inc. · published or filed Feb 24, 2026 · filing · curated facility atlasDescribes a multi-generation, portfolio-scale AMD Instinct agreement with Meta. It does not identify Hyperion as a delivery site.Original
Parecer da Comissão de Avaliação — AIA n.º 3633 “Data Center Sines 4.0” (estudo prévio)Agência Portuguesa do Ambiente · retrieved Sep 4, 2026 · regulator · curated facility atlasEvaluation-commission opinion dated July 2023 and retrieved September 4, 2026. It records that SIN01 (NEST) was exempted from AIA on December 17, 2021 and was already under construction, that the expansion (SIN02–06, REST) would reach up to 495 MW of IT power, that 444 emergency generators would total 1.2 GW, and that cooling uses seawater capture and rejection. IT-power and generator envelopes are permit boundaries, not operating load.Original
RECAPE do projeto Data Center Sines 4.0 (fases 2 a 6) — resumo não técnicoAgência Portuguesa do Ambiente (SIAIA) · retrieved Sep 4, 2026 · regulator · curated facility atlasEnvironmental-conformity report dated August 2024 and retrieved September 4, 2026. It states the DIA for AIA 3633 was a conditioned favourable decision, that the NEST pilot had 15 MW with a possible increase to 29 MW and was in final construction targeting Q3 2024 operation, and that seawater is captured and returned without consumption using former Sines coal-plant infrastructure. Targets and design descriptions are not commissioning or metered records.Original
Data Center Sines 4.0 — public consultation (AIA 3633)Agência Portuguesa do Ambiente / participa.pt · retrieved Sep 4, 2026 · government · curated facility atlasLiving public-participation record retrieved September 4, 2026 identifying START – Sines TransAtlantic Renewable & Technology Campus, S.A. as proponent of AIA procedure 3633, with consultation from May 26 to July 7, 2023. A consultation record is not a permit or an operating milestone.Original
Aker ASA First Quarter 2026 presentationAker ASA · published or filed May 8, 2026 · filing · curated facility atlasThe issuer presentation distributed with Aker’s market disclosure says the 30,000-plus-GPU Microsoft contract replaced the prior OpenAI letter of intent, the initial 230 MW is fully contracted, and another 290 MW remains in the queue. Contract and queue status do not establish installation or live draw.Original
Aker Finalizes Investment in Nscale and Joint Venture in NarvikAker ASA · published or filed Oct 13, 2025 · company · curated facility atlasConfirms that the 50/50 Aker–Nscale venture closed. The structure was subsequently rolled into Nscale in March 2026.Original
First Quarter 2026 shareholder letterAker ASA · published or filed May 8, 2026 · company · curated facility atlasSays Aker rolled its joint-venture stake into Nscale, Microsoft contracted the full Kvandal capacity, and the Microsoft commitment replaced OpenAI as intended anchor customer. Full contracted capacity is not live draw.Original
Independent Accountants’ Review Report and Schedules of Select Environmental MetricsAlphabet / Ernst & Young LLP · published Jun 22, 2026 · company · data center primerCompany-reported schedules received limited assurance, which is lower than reasonable assurance. Data-center water covers owned and fully leased facilities, excludes seawater returned to sea, and includes estimates where meters or invoices were unavailable.Original
AWS activates Project Rainier: One of the world's largest AI compute clusters comes onlineAmazon · published or filed Oct 29, 2025 · company · curated facility atlasThe chip total covers a multi-data-center U.S. cluster, not the Indiana buildings alone.Original
AWS plans to invest $10 billion in Mississippi, the largest capital investment in the state’s historyAmazon · published or filed Jan 25, 2024 · company · curated facility atlasAnnounces two Madison County data-center complexes but does not identify either as part of Project Rainier.Original
Amazon plans $20 billion Pennsylvania investment in cloud infrastructure and AI innovationAmazon · published or filed Jun 9, 2025 · company · curated facility atlasConfirms statewide AI and cloud infrastructure intent. The $20 billion figure is statewide, not a Salem-campus capacity or spend allocation.Original
Amazon plans to invest $10 billion in North Carolina to expand cloud computing infrastructure and advance AI innovationAmazon · retrieved Sep 4, 2026 · company · curated facility atlasCompany page retrieved September 4, 2026 without a visible publication date. It repeats the $10 billion, 500-job commitment and a $150,000 community fund and does not mention Trainium, Project Rainier, power, or water.Original
Amazon plans to invest $25 billion in Mississippi data centers, create 2,000 jobsAmazon · published or filed Apr 9, 2026 · company · curated facility atlasNames Mississippi data-center geographies and a Canton cooling plan but does not identify a campus as Project Rainier or allocate Trainium2 hardware.Original
Amazon.com announces fourth quarter resultsAmazon · published or filed Feb 5, 2026 · company · curated facility atlasReports 500,000-plus Trainium2 chips for multi-data-center Project Rainier and Claude training; it does not allocate chips or workloads to St. Joseph County.Original
Inside Amazon's approach to data center sustainability: a conversation with Brandon OyerAmazon Sustainability · published or filed Jun 12, 2026 · company · curated facility atlasDescribes Project Rainier in northern Indiana as a 2.2 GW campus designed to rely entirely on outside air for 97–98% of the year. Planned campus scale and cooling design are not measured demand or water consumption.Original
Inside Project RainierAmazon Web Services · published Oct 29, 2025 · company · data center primerOriginal
Our OriginsAmazon Web Services · accessed Aug 13, 2026 · company · data center primerOriginal
Anthropic and Amazon expand collaboration for up to 5 gigawatts of new computeAnthropic · published or filed Apr 20, 2026 · company · curated facility atlasAnthropic says it uses more than one million Trainium2 chips across its Amazon relationship. That relationship-wide count is not an Indiana or Rainier-only allocation.Original
Anthropic invests $50 billion in American AI infrastructureAnthropic · published or filed Nov 12, 2025 · company · curated facility atlasAnnounces custom data centers with Fluidstack in Texas and New York coming online throughout 2026, about 800 permanent and 2,400 construction jobs. It names no city, county, site, MW, or partner beyond Fluidstack.Original
Powering the next generation of AI development with AWSAnthropic · published or filed Nov 22, 2024 · company · curated facility atlasOriginal
Applied Digital Achieves Ready for Service for Phase 1 at Polaris Forge 1 Building 1 for CoreWeaveApplied Digital · published or filed Oct 27, 2025 · company · curated facility atlasReports Ready for Service for the first 50 MW phase of Building 1 with the next 50 MW expected before year-end, and describes liquid cooling with near-zero water consumption. Landlord RFS is not tenant production compute.Original
Applied Digital Completes Phase II Ready for Service at Polaris Forge 1, Fully Energizing First 100 MW BuildingApplied Digital · published or filed Nov 24, 2025 · company · curated facility atlasReports Building 1 at its full 100 MW critical IT load for CoreWeave, the first of three contracted buildings, and a separate Polaris Forge 2 lease. Energized building capacity is not measured load or chip count.Original
Applied Digital Delivers Second Building at Polaris Forge 1Applied Digital · published or filed Jul 1, 2026 · company · curated facility atlasReports Building 2 Phase 1 (75 MW) Ready for Service, bringing live campus capacity to 175 MW of 400 MW contracted. The release does not name the tenant for this phase or a production-workload date.Original
Applied Digital Finalizes Additional 150MW Lease with CoreWeave in North DakotaApplied Digital · published or filed Aug 29, 2025 · company · curated facility atlasBrings CoreWeave’s leases at Polaris Forge 1 to 400 MW across three buildings (100 MW in Q4 2025, 150 MW mid-2026, 150 MW in 2027) with about $11 billion of anticipated revenue over roughly 15-year terms, and describes the campus as engineered to scale to 1 GW. Leases and schedules are not delivered capacity.Original
Applied Digital Reports Fiscal Fourth Quarter and Full Year 2026 ResultsApplied Digital · published or filed Jul 27, 2026 · company · curated facility atlasRestates the first 100 MW online in October 2025 and Building 2 Phase 1 delivered June 30, 2026 for 175 MW live, $1.59 billion of senior secured notes funding Building 4 (150 MW), and a memorandum with CoreWeave to assign the Building 4 lease to a CoreWeave subsidiary upon an investment-grade rating. It does not disclose chips, workloads, or interval load.Original
AI giant Anthropic pens $9B lease near Austin at former Alcoa Corp. plantAustin American-Statesman (via Yahoo Finance) · published or filed Aug 12, 2026 · journalism · curated facility atlasReports Bloomberg sources identifying Anthropic as the Rockdale tenant, describes the former Alcoa site in Milam County with about 700 MW of grid-connected capacity developed in 2023 for mining, and notes a 2026 filing for an additional building. Neither party confirmed the identification, and the reported 700 MW is site power context, not the leased data center.Original
Acquisition of Digital 9 SeaEdge Ltd by Stellium Datacentres LtdBDO UK · published or filed Jun 10, 2025 · company · curated facility atlasTransaction adviser account identifying Stellium as the existing Data Centre 1 tenant/operator and purchaser of its property-owning company. It predates Stargate UK and does not make Stellium a Stargate counterparty.Original
Final approval of original AWS Aragón PIGABOA · published or filed Jul 31, 2020 · government · curated facility atlasPlanning/building/urbanization approval; not operation.Original
Order EEI/1979/2023, Microsoft La Muela campusBOA · published or filed Jan 9, 2024 · government · curated facility atlasAgreement dated 2023-12-20; phased ~25,000-m² buildings.Original
Order FOM/1040/2025, partial final AWS expansion planBOA · published or filed Aug 25, 2025 · government · curated facility atlasOrder dated 2025-08-22; planning approval, not operation.Original
Order FOM/652/2024, fourth electrical-infrastructure phaseBOA · published or filed Jun 21, 2024 · government · curated facility atlasOrder dated 2024-06-11; nameplate/approval not current draw.Original
Order PEJ/285/2025, new Microsoft Zaragoza campusBOA · published or filed Mar 24, 2025 · government · curated facility atlasAgreement dated 2025-02-28; 2026 phase-1 projection only.Original
Order PEJ/546/2025, Villamayor campus redelineationBOA · published or filed May 28, 2025 · government · curated facility atlasReferences 2024-07-03 original declaration; four subareas.Original
Villamayor Microsoft expropriation act datesBOA · published or filed Jan 13, 2026 · government · curated facility atlasLand process, not construction.Original
Airtel partners with Google to establish India’s first mega AI hub and data center in VisakhapatnamBharti Airtel · published or filed Oct 14, 2025 · company · curated facility atlasSays Airtel and Google will jointly establish a purpose-built data center and a cable landing station in Visakhapatnam and that Airtel will build fibre networks. Partner roles are announced intentions, not a signed lease, title record, or operating role.Original
Black Hills Corp. Reports 2026 Second-Quarter Results and Reaffirms 2026 Earnings GuidanceBlack Hills Corp. (release via Yahoo Finance) · published or filed Aug 5, 2026 · company · curated facility atlasStates that Wyoming Electric entered an April 22, 2026 agreement to procure long lead-time generation equipment with a prospective 1.8 GW data-center customer, amended in July 2026 to raise refundable advances to $377 million with an August 31, 2026 maturity ($285 million received by June 30), that it filed a Large Customer Transmission Cost Adjustment Mechanism tariff on June 19, and that definitive agreements were still being negotiated. It names neither the customer, Tallgrass, nor Crusoe, and is syndicated from the company release because the investor-relations file was unreachable at review.Original
Samsung, SK hynix to help OpenAI construct Stargate datacenters in KoreaBlocks & Files · published or filed Oct 13, 2025 · journalism · curated facility atlasReports an SK hynix/OpenAI facility in Jeollanam-do, a Samsung/OpenAI facility at Pohang, and 20 MW of initial capacity. Reported provinces and an initial MW figure are not site records or contracts.Original
MGX, Bpifrance, Mistral AI et NVIDIA annoncent la création d’une joint-venture pour développer en France le plus grand campus IA d’EuropeBpifrance · published or filed May 19, 2025 · company · curated facility atlasAnnounces the joint venture, a 1.4 GW target in Île-de-France, construction from the second half of 2026 and operation by 2028, and ecosystem partners Bouygues, EDF, École Polytechnique, RTE, and Sipartech. Later public records place construction in 2027, so the announced schedule is superseded.Original
Change of business enterprise name — Nordscale Operations AS (937 388 977)Brønnøysund Register Centre · published or filed Aug 7, 2026 · regulator · curated facility atlasOfficial name change from WR START UP 601 AS. Nscale described an established venture on July 6 before the legal-name change; this is commercial-versus-registry chronology, not proof of wrongdoing or live compute.Original
NORDSCALE OPERATIONS AS — entity record 937 388 977Brønnøysund Register Centre · retrieved Aug 14, 2026 · regulator · curated facility atlasLiving registry record retrieved August 14, 2026. It gives founding/registration chronology, a Narvik address, and a current data-center-operation purpose. It does not establish the company-reported 51/49 shareholding.Original
Argentine government and OpenAI announce project to build data center in PatagoniaBuenos Aires Herald · published or filed Oct 10, 2025 · journalism · curated facility atlasReports the presidential announcement, the Patagonia framing, the up-to-500 MW and US$25 billion figures, and the RIGI structure. Government announcement of a letter of intent is not a filing, permit, or site record.Original
Chau GPT? No trace of mega-billion-dollar AI project announced before electionsBuenos Aires Times · published or filed May 28, 2026 · journalism · curated facility atlasReports that the Economy Ministry said the project had not been presented under RIGI, that a RIGI Observatory researcher found no updated information, and that OpenAI and Sur Energy declined follow-up. This is contradiction evidence against progress, not proof of cancellation.Original
OpenAI, Sur Energy to build massive AI data centre in PatagoniaBuenos Aires Times · published or filed Oct 10, 2025 · journalism · curated facility atlasReports OpenAI as the intended main buyer of computing capacity and Sur Energy as implementation lead, and states that no exact location or start date was provided.Original
Georgia Power gets clearance to serve OpenAI’s massive AI data center in Effingham CountyCBS News Atlanta · published or filed Aug 27, 2026 · journalism · curated facility atlasReports that Public Service Commission staff reviewed the Georgia Power–OpenAI agreement and declined to object without a public vote, that the contract covers up to 3,200 MW phased from 2028 through 2032 with up to 1,000 MW of curtailable demand and OpenAI paying full infrastructure costs. A cleared contract is not construction or energized load.Original
La Junta aprueba la reparcelación del centro de Meta en TalaveraCLM24 · published or filed Aug 21, 2026 · journalism · curated facility atlasReports the resolution of August 7, 2026 published in DOCM no. 160 on August 21, 2026, the April 16, 2025 reparcelation request, a €1,089,554 guarantee to be constituted by Zarza Networks, and that construction projects and permits follow. It gives no construction timeline.Original
La concertation — Campus IACampus IA · retrieved Sep 4, 2026 · company · curated facility atlasLiving project-owner page retrieved September 4, 2026 stating that Campus IA and RTE co-sponsored the October 13–November 23, 2025 concertation ahead of environmental-authorization filings. It is the developer’s own account.Original
Crusoe, Tallgrass get green light for Wyoming AI energy campusCap City News · published or filed Jan 6, 2026 · journalism · curated facility atlasReports Laramie County commissioners’ unanimous January 6, 2026 approval of site plans for Project Jade (Crusoe Energy Systems) and Tallgrass’s BFC Power and Cheyenne Power Hub, a $7 billion energy investment, 2.7 GW of on-site gas generation, Lance Formation wells with closed-loop cooling, first energization targeted for the second quarter of 2027, and a first building operational by end of 2027. Site-plan approval is not a building permit, air permit, or construction.Original
OpenAI fuels Korea AI data centre push with Samsung SDS and SK TelecomCapacity · published or filed Feb 11, 2026 · journalism · curated facility atlasReports that SK Telecom was still in talks with OpenAI on a southwestern data centre with a construction timeline under review, and a ministerial statement that the companies were preparing to start construction. Talks and preparation are not a start of construction.Original
Pure DC launches largest-ever AI data centre project in FinlandCapacity · published or filed Jul 15, 2026 · journalism · curated facility atlasReports the same launch claims without naming the phase-1 tenant or a delivery date. It corroborates the announcement only.Original
Certificate of 2024-09-03 project agreementCastilla-La Mancha · published or filed Feb 12, 2026 · government · curated facility atlasFiling/upload date differs from underlying agreement; retain both in note.Original
Final executive project summaryCastilla-La Mancha Urbanismo · published or filed Oct 23, 2024 · government · curated facility atlasThe current official docket copy preserves the 2024 final project summary: 191 ha, Zarza wholly owned by Meta, and planning scale rather than IT load.Original
Initial approval/public information, Meta campusCastilla-La Mancha Urbanismo · published or filed Mar 31, 2023 · government · curated facility atlasThe current official docket copy preserves the dated 2023 initial approval/public-information record and the Zarza Networks SL/Meta relationship; initial only.Original
Meta Data Center Campus project hubCastilla-La Mancha Urbanismo · retrieved Aug 15, 2026 · government · curated facility atlasLiving authoritative docket/document index.Original
Second environmental-monitoring reportCastilla-La Mancha Urbanismo · published or filed Feb 12, 2026 · regulator · curated facility atlasThe report records a 2025-10-14 site visit and pre-construction environmental measures; it explicitly does not establish a construction phase.Original
Talavera reparcelation public-information noticeCastilla-La Mancha Urbanismo · published or filed Nov 24, 2025 · government · curated facility atlasOfficial public-information/process-initiation notice; it is not evidence of final approval of the reparcelation, construction, or operation.Original
Consolidated evaluation, Ampliación Data Center PARAMChile SEA · retrieved Aug 15, 2026 · regulator · curated facility atlasRetrieved-date record with the exact document day unresolved; expansion plan, not operation.Original
Dataluna Cerrillos DIAChile SEA · published or filed Jul 15, 2019 · filing · curated facility atlasOriginal two-building design; filing, not approval/operation.Original
Evaluation Commission agenda 1663Chile SEA · published or filed Aug 19, 2024 · regulator · curated facility atlasRecords request to relinquish RCA 127/2020; request alone is not final legal effectiveness.Original
Pertinence docket PERTI-2022-3020Chile SEA · retrieved Aug 15, 2026 · regulator · curated facility atlasResolved change request; not a new permit or operation.Original
Quilicura project details/construction milestoneChile SEA · retrieved Aug 15, 2026 · regulator · curated facility atlasRetrieved-date record with the exact signature day unresolved; start milestone, not current operation.Original
Cerrillos Data Center inspectable-unit recordChile SMA · retrieved Aug 15, 2026 · regulator · curated facility atlasLiving record lists RCA 127/2020 and no displayed inspections/sanctions/monitoring.Original
Quilicura fuel-storage inspectable-unit recordChile SMA · retrieved Aug 15, 2026 · regulator · curated facility atlasRCA 44/2016; no displayed inspections/sanctions; fuel permit not generator operation.Original
AMD, Cisco and HUMAIN expand Saudi Arabia’s AI infrastructure as AMD Instinct systems go liveCisco · published or filed Aug 31, 2026 · company · curated facility atlasCisco copy of the joint release with a Riyadh dateline; a dateline is not a facility location. No site, MW, or GPU count for the live deployment is disclosed.Original
Abilene City Council meeting — January 8, 2026City of Abilene · published or filed Jan 8, 2026 · government · curated facility atlasCity presentation gives an approximately 2 million-gallon-per-year operational projection for original buildings 1–8. It is a forecast, not metered use.Original
Data CentersCity of El Paso · retrieved Sep 4, 2026 · government · curated facility atlasLiving city page retrieved September 4, 2026. It records the December 2023 council approval of the Meta agreement filed under Wurldwide LLC, about 1,000 acres in Northeast El Paso north of Stan Roberts Sr. Avenue west of US-54 acquired from the city, a Chapter 380 agreement worth about $110 million for Phase 1 and up to $550 million across phases, a maximum 2.5 million gallons per day of water at full buildout, and El Paso Electric’s pursuit of a 366 MW McCloud gas installation. Agreement terms are not measured load or water.Original
Economic and competitiveness section decisions/statusCity of Espoo · published or filed Jun 1, 2026 · government · curated facility atlasMunicipal current-status support; under construction.Original
Second Hepokorpi building permitCity of Espoo · published or filed Mar 21, 2025 · government · curated facility atlasBoard decision 2025-03-20; permit not completion.Original
Hamina data center impacts as a research targetCity of Hamina · published or filed Jun 22, 2026 · government · curated facility atlasCurrent municipal account confirming the operating campus and that cooling heat is directed to the district-heating network. It does not publish first-delivery, monthly output, or water and heat meter series.Original
Temporary environmental permit for expansion earthworksCity of Hamina · published or filed Jan 27, 2026 · government · curated facility atlasRock crushing/earthworks; not building/compute operation.Original
Otanmäki–Alussuo zoning proposalCity of Kajaani · published or filed Mar 31, 2026 · government · curated facility atlas392-ha proposal; public consultation is not project permit.Original
Ordinance 220949, Rocky Branch data-center campus planCity of Kansas City, Missouri · published or filed Nov 3, 2022 · government · curated facility atlasAdopted rezoning and preliminary development plan for about 360 acres northeast of Highways 169 and I-435. Planning approval is not construction, occupancy, energization or operation.Original
Ordinance 240064, Meta data-center warning sirenCity of Kansas City, Missouri · published or filed Feb 1, 2024 · government · curated facility atlasAdopted ordinance explicitly locates the new Meta Data Center just north of I-435 and N. 169 Highway. The siren appropriation corroborates identity/location, not a building or operating milestone.Original
Building Together: City of Memphis Weekly NewsletterCity of Memphis · published or filed Apr 10, 2026 · government · curated facility atlasThe mayor describes a temporary suspension of work at the xAI wastewater facility. This establishes neither abandonment nor recycled-water delivery.Original
Data Centers GIS layerCity of Mesa · retrieved Aug 15, 2026 · government · curated facility atlasQuery and freeze exact feature before use; layer alone is not entity match.Original
Resolution 11680, Redale development/water agreementCity of Mesa · published or filed Jun 21, 2021 · government · curated facility atlasDated city resolution; allowances and maximums are not measured use.Original
Study-session minutes, Google projectCity of Mesa · published or filed Jun 27, 2019 · government · curated facility atlasDesire/lease/timeline context; no construction.Original
2024 annual comprehensive financial reportCity of New Albany · retrieved Aug 15, 2026 · government · curated facility atlasMonth precision; reports projected 2026/2028 completions; not live status.Original
Community Development monthly report, Dec. 2025City of New Albany · retrieved Aug 15, 2026 · government · curated facility atlasMonth precision; plan-review entries including META NAH PSIP; review not permit/completion.Original
Community-development project updatesCity of New Albany · retrieved Aug 15, 2026 · government · curated facility atlasLiving list of Meta building shells; not a Prometheus cluster mapping.Original
Proposed 2026 annual budget/programCity of New Albany · published or filed Nov 4, 2025 · government · curated facility atlas~1.4m-ft² Meta expansion snapshot 2025-09-30; shell area not compute.Original
Statement regarding Meta’s nuclear energy projectsCity of New Albany · published or filed Jan 15, 2026 · government · curated facility atlasStates no nuclear plant is planned in the city and the data-center campus draws from the regional grid.Original
Vantage Well Utilization Plan and Fact SheetCity of Port Washington · published or filed Aug 7, 2026 · government · curated facility atlasThe official City news index links the project well materials. It does not by itself establish operating consumption or a campus-wide withdrawal limit.Original
Google establishment timelineCity of Skien · retrieved Aug 15, 2026 · government · curated facility atlasLiving page; build decision Feb 2024 and building-2 groundwork application Aug 2025.Original
FY2023 adopted budgetCity of Temple · retrieved Aug 15, 2026 · government · curated facility atlasRetrieved-date basis until adoption date is extracted; municipal selection/investment context only.Original
Cobalt Park connectivity and data-centre availabilityCobalt Park · retrieved Aug 14, 2026 · company · curated facility atlasLiving property page reviewed on the recorded date. It markets Data Centres 2 and 3 as move-in-ready shells with liquid and immersion cooling options; those options are not an OpenAI/Nscale design, contract, or water measurement.Original
Bilan de la concertation préalable L121-17 — Campus IACommission nationale du débat public · published or filed Dec 22, 2025 · government · curated facility atlasGuarantors’ report dated December 22, 2025. It records phase 1 as three data-center buildings, a training building, and a provisional 700 MW source substation by 2028 under RTE’s Fast Track programme using dry cooling, phase 2 as nine further buildings and a definitive 1,400 MW RTE substation from 2029, and a total called power of 1,400 MW. Described phases are project intentions, not approvals.Original
Datacenters et infrastructure de raccordement au réseau électrique (Campus IA) à FoujuCommission nationale du débat public · retrieved Sep 4, 2026 · government · curated facility atlasLiving CNDP project page retrieved September 4, 2026 describing about 12 data-center buildings on roughly 70 hectares at Fouju, a 400 kV RTE connection for an estimated 1.4 GW, a €35 billion estimate, phase 1 by 2028 and phase 2 from 2029, the October 13–November 23, 2025 concertation, and a final guarantors’ analysis on April 24, 2026. Concertation records are not permits.Original
Projet Campus IACommunauté de communes Brie des Rivières et Châteaux · retrieved Sep 4, 2026 · government · curated facility atlasLiving municipal page retrieved September 4, 2026 placing the project on the former ZAC des Bordes at Fouju, describing 240 MW by end-2027, 700 MW from 2030, and 1,400 MW in 2038, dry cooling with no withdrawal from the Champigny aquifer in phase 1, a direct RTE 400 kV connection, a completed public inquiry, a pending building permit, and construction beginning in 2027. Municipal descriptions of phases are not permits or contracts.Original
Timeline of Computer History: ENIACComputer History Museum · accessed Aug 13, 2026 · research · data center primerHistorical dimensions and component-count context; ENIAC is treated as an ancestor, not a modern data center.Original
Aprobación definitiva del proyecto de reparcelación — PSI Meta Data Center Campus (DOCM núm. 160)Consejería de Fomento, Castilla-La Mancha · published or filed Aug 21, 2026 · government · curated facility atlasTechnical document of the definitively approved reparcelation project as listed on the regional planning portal against DOCM no. 160 of August 21, 2026. Land-management approval is not a building permit, construction start, or energization.Original
Partner Pulling Out Doesn’t Slow Huge 2.7GW Cheyenne Project Jade Data CenterCowboy State Daily · published or filed Jun 11, 2026 · journalism · curated facility atlasReports that Crusoe demobilized about two months earlier, that Tallgrass says work never stopped and it now works directly with the undisclosed client, that dirt work has begun with generators expected to ramp in summer 2027 and client service in early 2028, and that Black Hills filed a substation CPCN in January 2026 and agreed in April 2026 to procure long lead-time generation equipment. Reported earthwork is not a data-hall building permit or energization.Original
Crusoe Announces New 900 MW AI Factory Campus in Abilene, Texas to Support Microsoft AI InfrastructureCrusoe · published or filed Mar 27, 2026 · company · curated facility atlasStates that two 100 MW buildings at the original Abilene project were constructed and energized. Energized building capacity is not measured demand or critical-IT load.Original
Crusoe and Lancium announce Childress campusCrusoe · published Jul 15, 2026 · company · data center primerOriginal
Crusoe and Tallgrass announce AI data center in WyomingCrusoe · published or filed Jul 24, 2025 · company · curated facility atlasAnnounces a 1.8 GW southeast Wyoming AI campus designed to scale to 10 GW with Tallgrass providing gas, water, and CO2-sequestration assets. It gives no city, timeline, permit, or construction record, and Crusoe later left the project per local reporting.Original
Crusoe expands Abilene campus to 1.2 gigawattsCrusoe · published Mar 18, 2025 · company · data center primerOriginal
AI sovereignty for Germany and Europe: Deutsche Telekom launches one of Europe’s largest AI factories with NVIDIADeutsche Telekom · published or filed Nov 4, 2025 · company · curated facility atlasAnnounces a Munich AI factory renovated with Polarise to host more than 1,000 DGX B200 systems and RTX PRO servers with up to 10,000 Blackwell GPUs, 0.5 EFLOPS, and operation from Q1 2026. Planned counts and performance are not an installed inventory or measured load.Original
Germany’s first AI factory for industry officially goes into operation in MunichDeutsche Telekom · published or filed Feb 4, 2026 · company · curated facility atlasRecords the February 4, 2026 opening at Tucherpark in a renovated former bank data center of about 10,700 m², nearly 10,000 Blackwell GPUs, operation at over a third of capacity, water cooling from the Eisbach with waste heat supplied to the district, and renewable electricity. Company statements of utilisation and supply are not meter records.Original
Project Jupiter Series 2025A IRB Agreements and Community Benefits AgreementDoña Ana County · published or filed Nov 12, 2025 · government · curated facility atlasExecuted and recorded county package identifies project entities, the approximately 819-acre scope, investment ceilings, expected construction/operation milestones, and a 20,000-gallon-per-day average/60,000-gallon-per-day cap for office potable use. Forecasts and service limits are not meter readings.Original
Amazon Plans to Invest $10 Billion in Richmond County North Carolina for AI InfrastructureEconomic Development Partnership of North Carolina · published or filed Jun 4, 2025 · government · curated facility atlasIdentifies the site as an EDPNC Selectsite Readiness Program property and repeats the investment and job figures. It gives no acreage, buildings, incentives, utility, or timeline.Original
Project Camellia (OpenAI Data Center)Effingham County, Georgia · retrieved Sep 4, 2026 · government · curated facility atlasLiving county page retrieved September 4, 2026. It describes a 1,400-acre campus at the Savannah Gateway Industrial Hub, a minimum $20 billion investment in five phases, PILOT payments beginning in 2027 and full build-out revenue by 2032, closed-loop cooling using treated surface water rather than the Floridan aquifer, an August 29 work session, and an $80 million community commitment. Revenue projections are not permits, construction, or load.Original
El Paso Electric filings detail power plant impact behind Meta’s $10 billion data centerEl Paso Matters · published or filed Mar 29, 2026 · journalism · curated facility atlasReports El Paso Electric’s PUCT filings for the 366 MW McCloud facility of 813 small gas generators costing nearly $500 million, with Meta bearing the cost during a one-to-five-year bridge period before the plant enters retail rates, plus about 400,000 gallons per day of water use and construction under way since October 2025. Regulatory filings are proposals, not approvals or operating records.Original
Meta-Abbott agreement on data center guidelines appears to have no effect on El Paso plansEl Paso Matters · published or filed Aug 10, 2026 · journalism · curated facility atlasReports and photographs the campus under construction on August 5, 2026, notes BlackRock’s 80% stake, states that the 2023 city and county 25-year 80% tax break remains in effect, and observes that the governor’s ERCOT-specific guidelines do not mention El Paso Electric. It does not establish energization or compute.Original
Project Document — Project Teros, Canelones, UruguayEleanor Applications S.R.L. via Ministerio de Ambiente · published or filed Oct 24, 2023 · filing · curated facility atlasPrimary revised-project document for one building in four modules. Annual electricity, water, commissioning-fill, chiller, substation, and schedule values are designs or forecasts rather than capacity conversions or measurements.Original Archive
NPRR1267 — Large Load Interconnection Status ReportElectric Reliability Council of Texas · published or filed Jul 31, 2025 · utility · curated facility atlasApproved protocol revision requires public large-load status reporting to be aggregated because customer-specific information is confidential; it does not supply Abilene interval load.Original
Entergy Louisiana receives LPSC approval for major infrastructure investments to support Meta’s data center and improve reliabilityEntergy Louisiana · published or filed Aug 20, 2025 · utility · curated facility atlasDescribes three approved combined-cycle plants totaling 2,262 MW, transmission, and authorization to procure up to 1,500 MW of solar. Those supply resources are not facility capacity or hourly delivered mix.Original
Facts about the QTS Fayetteville Data Center Campus ProjectFayette County, Georgia · published or filed May 13, 2026 · government · curated facility atlasCounty statement that the QTS campus uses less than 1% of Fayette County Water’s roughly 17.3 million gallons per day of production against 22.8 million gallons per day of permitted capacity, pays a $6.46 per 1,000 gallons construction rate, and that earlier billing confusion came from meter-system migration. It does not name Microsoft, MW, or tenant buildings.Original
Order rejecting Susquehanna interconnection service agreement amendmentFederal Energy Regulatory Commission · published or filed Nov 1, 2024 · regulator · curated facility atlasRejects the proposed 300-to-480-MW nonconforming amendment, not the campus or later front-of-meter relationship. Litigant cost-shift estimates are not Commission findings.Original
RM26-4: Large Load InterconnectionFederal Energy Regulatory Commission · updated Jul 22, 2026 · regulator · data center primerPre-rulemaking, not a final nationwide siting rule.Original
RS terá a primeira cidade de data centers da América LatinaFederasul (Tá na Mesa) · published or filed Aug 11, 2026 · journalism · curated facility atlasBusiness-federation event report stating the project is in environmental, urban-planning, and road licensing with operations expected by the end of 2028 and an authorized connection of up to 5 GW. It is a dated status account, not a licence or construction record.Original
Espoo data-center-area EIAFinland environmental administration · published or filed Feb 4, 2024 · government · curated facility atlasUpdated 2024-07-09; EIA conclusion 2024-06-04.Original
Kajaani–Otanmäki data-center EIAFinland environmental administration · published or filed Jun 25, 2025 · government · curated facility atlasUpdated 2026-03-03; docket KAIELY/307/2025; EIA pending.Original
Kirkkonummi data-center EIAFinland environmental administration · published or filed Mar 25, 2024 · government · curated facility atlasUpdated 2025-04-25; records 3.3-MWel generator correction.Original
Microsoft Espoo EIA reportFinland environmental administration · published or filed Jan 29, 2024 · government · curated facility atlasFour-building design; no operation.Original
Microsoft Vihti EIA reportFinland environmental administration · published or filed Feb 1, 2024 · government · curated facility atlasFour-building, independently operating future campus design.Original
Muhos EIA programFinland environmental administration · published or filed Sep 16, 2025 · government · curated facility atlasNine buildings; alternatives only.Original
Muhos data-center EIAFinland environmental administration · published or filed Sep 11, 2025 · government · curated facility atlasUpdated 2025-12-02; docket POPELY/2472/2025; pending.Original
Public notice, Muhos EIA programFinland environmental administration · published or filed Sep 29, 2025 · government · curated facility atlasProcedural milestone only.Original
Tuike Finland Oy data center, Hamina — environmental impact assessmentFinland environmental administration · published or filed Jun 24, 2024 · regulator · curated facility atlasKASELY/148/2023 project page identifying Tuike as proponent and separating the existing seven-building program from four conceptual expansion buildings without an investment decision.Original
Tuike Kajaani EIA programFinland environmental administration · published or filed Jun 25, 2025 · government · curated facility atlasEight-building alternatives; program, not decision.Original
Fluidstack selected by Anthropic to deliver custom data centers in New York and TexasFluidstack · published or filed Nov 12, 2025 · company · curated facility atlasFluidstack’s companion announcement repeats the Texas and New York program, jobs, and 2026 timing without naming a site, county, MW, or landlord.Original
Heat production starts at two large data-centre sitesFortum · published or filed May 6, 2026 · company · curated facility atlasInitial ambient-air/electric-boiler heat; Microsoft waste heat later.Original
Global tech alliance launches Stargate UAEG42 · published or filed May 22, 2025 · company · curated facility atlasSite-specific launch record says G42 will build the cluster, OpenAI and Oracle will operate it, NVIDIA will provide Grace Blackwell GB300 systems, Cisco will provide connectivity, and a first 200 MW was expected in 2026. Every verb is prospective; quantity, delivery, energization, acceptance, and live compute remain unproven.Original
G42 Provides Update on Construction of Stargate UAE AI Infrastructure ClusterG42 via PR Newswire · published or filed Oct 16, 2025 · company · curated facility atlasIdentifies Khazna as developer and reports the first 200 MW under construction with long-lead equipment procured and initial mechanical deliveries. It does not report commissioning or accelerator delivery.Original
10 datos sobre el centro de datos de Google en Quilicura, ChileGoogle · published or filed Mar 31, 2026 · company · curated facility atlasOriginal
A new data center in Latin AmericaGoogle · published or filed Aug 29, 2024 · company · curated facility atlasOriginal
Carbon-free data center in ArizonaGoogle · published or filed Mar 14, 2024 · company · curated facility atlasConstruction began 2023; 2025 operation target; air cooling; >430-MW portfolio agreements.Original
Cooling the cloud: a look inside Google’s data centersGoogle · published Oct 23, 2012 · company · data center primerDocuments active air handling, hot-aisle containment, and water-based facility cooling well before the current AI cycle.Original
Expanding our Texas presence with a new data center and clean energy in Wilbarger CountyGoogle · published or filed Feb 24, 2026 · company · curated facility atlasDescribes a Wilbarger County data center under construction alongside new clean power developed by AES, advanced air-cooling limiting water to critical campus operations, and a statewide 7,800 MW contracted-generation figure. Investment, MW, completion date, and the AES project technology are not disclosed.Original
Google and Intersect Deepen Texan Roots with New Data Center and Energy Investments in Gray and Roberts CountiesGoogle · published or filed Jun 4, 2026 · company · curated facility atlasAnnounces construction of the Meitner Energy Center in Gray and Roberts Counties with a data center to be built alongside more than a gigawatt of wind, solar and storage plus minority on-site gas firming, air-cooling limiting water to domestic uses, a Wheeler County workforce hub, and states that Quantum in Haskell County begins operations in June 2026, that the Haskell Google data center recently began construction, that Google closed its Intersect acquisition in March 2026, and that data centers are under construction in Armstrong, Haskell and Wilbarger Counties. Announced construction is not energization.Original
Google announces new $40 billion investment in TexasGoogle · published or filed Nov 14, 2025 · company · curated facility atlasAnnounces $40 billion through 2027, one data center in Armstrong County and two in Haskell County, one Haskell campus paired with a new solar and battery plant, more than 6,200 MW of contracted Texas generation and capacity, and a $30 million Energy Impact Fund. Program totals and portfolio PPAs are not site load or hourly supply.Original
Hamina, Finland data centerGoogle · accessed Aug 13, 2026 · company · data center primerOriginal
Impact Study: Finland Data CenterGoogle · retrieved Aug 14, 2026 · company · curated facility atlasUndated impact-study PDF reviewed on the recorded date. It reports 98% hourly CFE matching and PUE 1.09 for 2023 plus more than 445 MW of operational renewable contracts in Finland; contract nameplate is not Hamina capacity or physical hourly supply.Original
Ironwood: The first Google TPU for the age of inferenceGoogle · published or filed Apr 9, 2025 · company · curated facility atlasEstablishes Google as the designer of its custom TPU AI accelerators; it does not locate Ironwood at a specific facility in this dataset.Original
Measuring the Environmental Impact of Delivering AI at Google ScaleGoogle · published Aug 21, 2025 · company · data center primerCompany methodology for a May 2025 median Gemini Apps text prompt; excludes training, external networks, end-user devices, and data storage.Original
Our first AI hub in India, powered by a $15 billion investmentGoogle · published or filed Oct 14, 2025 · company · curated facility atlasAnnounces approximately $15 billion over 2026–2030 for a gigawatt-scale AI hub in Visakhapatnam with AdaniConneX and Airtel, a subsea gateway, and work on transmission, clean generation, and storage. Investment and gigawatt-scale language are not a site capacity, contract, or load record.Original
Our first offsite heat recovery project lands in FinlandGoogle · published or filed May 20, 2024 · company · curated facility atlasAnnounces a future offsite heat-recovery project and expected annual output; it is not proof that heat was already flowing or a delivered-heat meter record.Original
Google to invest $1 billion in United Kingdom data centreGoogle (via PR Newswire) · published or filed Jan 18, 2024 · company · curated facility atlasAnnounces a $1 billion data centre on a 33-acre Waltham Cross site purchased in October 2020, states construction has started, and describes air-based cooling and heat-recovery readiness. Investment and construction-start statements are not capacity or load.Original
Cloud TPU regions and zonesGoogle Cloud · retrieved Aug 14, 2026 · company · curated facility atlasLiving customer-facing TPU catalog reviewed on the recorded date. It does not list europe-north1; that absence cannot establish that no Google-internal TPU is installed at Hamina.Original
Compute Engine regions and zonesGoogle Cloud · retrieved Aug 14, 2026 · company · curated facility atlasLiving service catalog reviewed on the recorded date. It identifies europe-north1-a/b/c as Hamina and lists available machine families, but does not publish physical inventory, quantity, utilization, or building allocation.Original
Enabling 1 MW IT racks and liquid cooling at OCP EMEA SummitGoogle Cloud · published Apr 29, 2025 · company · data center primerGoogle says TPU v3 introduced liquid cooling in 2018; 500 kW–1 MW figures are a roadmap/capability, not an average rack.Original
GCP arrives in the Nordics with a new region in FinlandGoogle Cloud · published or filed Jun 18, 2018 · company · curated facility atlasLocates the europe-north1 Google Cloud region in the existing Hamina data center. A region attribution is not a building inventory, model assignment, or workload share.Original
Gemini serving locationsGoogle Cloud · retrieved Aug 14, 2026 · company · curated facility atlasLiving page reviewed on the recorded date and last updated August 11, 2026. It lists Finland as a possible Gemini Code Assist serving region but warns that the product is globally load-balanced and prompts might be processed at any Google Cloud data center.Original
Google Cloud Platform subprocessorsGoogle Cloud · retrieved Aug 14, 2026 · company · curated facility atlasLiving legal-operations table reviewed on the recorded date. It lists Tuike Finland Oy, company number 2206071-7, for data-center operations in Finland at Ensontie 1, Hamina.Original
Google announces plans to invest US$1 billion to build data center and cloud region in ThailandGoogle Cloud · published or filed Sep 30, 2024 · company · curated facility atlasAnnounces a US$1 billion investment covering a data center in Chonburi and a cloud region in Bangkok. No MW, site, construction, or operation date is given.Original
Google breaks ground on India AI hubGoogle Cloud · published or filed Apr 28, 2026 · company · curated facility atlasRecords a groundbreaking at Tarluvada, Visakhapatnam, with AdaniConneX and Nxtra by Airtel and describes the start of construction. Groundbreaking is not a building, energization, or compute milestone.Original
Google opens Waltham Cross data centre as part of two-year £5 billion investment in the UKGoogle Cloud · published or filed Sep 16, 2025 · company · curated facility atlasRecords the opening of the Waltham Cross data centre in Broxbourne, air cooling limiting water to domestic use, readiness for off-site heat recovery, and Shell Energy Europe as 24/7 carbon-free-energy manager. The £5 billion figure is a UK-wide two-year programme, not the site’s cost or capacity.Original
Canelones, Uruguay — Google data center locationGoogle Data Centers · retrieved Aug 14, 2026 · company · curated facility atlasLiving location page reviewed on the recorded date. It labels Canelones “En desarrollo” and an upcoming data center; it does not publish module commissioning or first compute.Original
Google commits to increasing energy abundance and reliability for TexansGoogle Data Centers · published or filed Nov 14, 2025 · company · curated facility atlasSays one new Haskell data center will be co-located with a new solar and battery plant through Google’s partnership with Intersect and TPG Rise Climate and repeats the 6,200 MW portfolio figure. It gives no site MW, water, or construction status.Original
Texas – Google Data Center LocationGoogle Data Centers · retrieved Sep 4, 2026 · company · curated facility atlasLiving locations page retrieved September 4, 2026. It lists Midlothian and Red Oak as operating, describes new campuses in Armstrong, Haskell, Pampa and Wilbarger Counties, and records a 2026 announcement of Pampa and Wilbarger developments. Its milestone labels lag the company’s June 2026 construction statement.Original
Safety-first AI for autonomous data centre cooling and industrial controlGoogle DeepMind · published Aug 17, 2018 · company · data center primerOriginal
Advancing Malaysia togetherGoogle Malaysia · published or filed May 30, 2024 · company · curated facility atlasOriginal
The Datacenter as a ComputerGoogle Research · published Jan 1, 2009 · research · data center primerIntroduces the warehouse-scale-computer framing; it does not claim Google invented centralized computing.Original
The Google File SystemGoogle Research · published Jan 1, 2003 · research · data center primerOriginal
Web Search for a Planet: The Google Cluster ArchitectureGoogle Research · published Jan 1, 2003 · research · data center primerOriginal
AWS Aragón expansion PIGAGovernment of Aragón · retrieved Aug 15, 2026 · government · curated facility atlasLiving 2024–26 five-site expansion docket.Original
AWS original PIGA modification 2Government of Aragón · published or filed Jul 1, 2025 · government · curated facility atlasLiving modification hub; preserves three-campus boundary.Original
Fomento expropriation registryGovernment of Aragón · retrieved Aug 15, 2026 · government · curated facility atlasLiving registry; La Muela entry dated 2024-04-01.Original
La Muela hydraulic-infrastructure summaryGovernment of Aragón · retrieved Aug 15, 2026 · government · curated facility atlasDesign infrastructure, not withdrawal/consumption.Original
Microsoft PIGA hubGovernment of Aragón · published or filed Jul 15, 2026 · government · curated facility atlasLiving project/docket hub; three campuses remain distinct.Original
Original AWS three-campus PIGAGovernment of Aragón · published or filed Jul 30, 2020 · government · curated facility atlasHub establishes separate Huesca, El Burgo and Villanueva projects.Original
The IBM System/360IBM · accessed Aug 13, 2026 · company · data center primerOriginal
Draft significant source modification 141-48867-00642IDEM · retrieved Aug 15, 2026 · regulator · curated facility atlasDraft; blank affidavit does not prove completion.Original
Response to comments, permit T141-47750-00642IDEM · published or filed Jan 28, 2025 · regulator · curated facility atlasExplicit SBN100/SBN201 separate stationary-source boundary under common ownership.Original
Technical support document, SBN100 Part 70 permitIDEM · published or filed Jan 28, 2025 · regulator · curated facility atlasLegal source/equipment scope, not compute.Original
El Burgo de Ebro DIA and AAI, docket 500301/02/2019/12454INAGA/BOA · published or filed Aug 11, 2020 · regulator · curated facility atlasResolution 2020-07-27; permit not operation.Original
Huesca PLHUS DIA and AAI, docket 500301/02/2019/12452INAGA/BOA · published or filed Aug 7, 2020 · regulator · curated facility atlasResolution 2020-07-27; permit limits are not current load/use.Original
Villanueva de Gállego DIA and AAI, docket 500301/02/2019/12453INAGA/BOA · published or filed Aug 10, 2020 · regulator · curated facility atlas294.4 MWt backup-generator thermal capacity; never convert to IT/electrical MW.Original
WQA Walqa DIA and AAIINAGA/BOA · published or filed May 14, 2026 · regulator · curated facility atlasResolution 2026-04-28, docket 500301/02/2024/12131; separate from PLHUS.Original
WQA external hydraulic infrastructure EIAINAGA/BOA · published or filed Nov 6, 2025 · regulator · curated facility atlasResolution 2025-10-06; conditional favorable EIA, not consumption.Original
INNIO Secures Additional Major Order from VoltaGrid: 1.5 GW for Behind-the-Meter Power GenerationINNIO Group · published or filed Feb 11, 2026 · company · curated facility atlasSupplier announcement covers roughly 300 engines for multiple U.S. data-center projects through 2028. It does not allocate a quantity or commissioning date to Shackelford County.Original
Variance application, Building C/ACBIndiana DHS · retrieved Aug 15, 2026 · regulator · curated facility atlasSuccessor-by-merger detail; not completion.Original
Variance application, Building D/AWBIndiana DHS · retrieved Aug 15, 2026 · regulator · curated facility atlasCode variance only.Original
Variance application, Buildings 1–9Indiana DHS · retrieved Aug 15, 2026 · regulator · curated facility atlasR-454B/mechanical-code scope; not occupancy.Original
Second Revised Semi-Annual Large Load Customer Progress Report — Cause No. 46097Indiana Michigan Power · published or filed Sep 18, 2025 · utility · curated facility atlasPublic I&M report required by Cause No. 46097. Its public values aggregate large-load customers and do not disclose Rainier interval demand or energy.Original
Public Exhibit No. 1 — Cause No. 46097Indiana Office of Utility Consumer Counselor · published or filed Oct 15, 2024 · filing · curated facility atlasFiled testimony in IURC Cause No. 46097 discusses the AWS St. Joseph County project and large-load risk. Forecast load is not actual or interval demand.Original
Order of the Commission — Cause No. 46097Indiana Utility Regulatory Commission · published or filed Feb 19, 2025 · regulator · curated facility atlasThe order identifies Indiana Michigan Power as the serving utility and recounts 2,250 MW of anticipated AWS energy use. It requires customer reports but protects customer-specific data as confidential; 2,250 MW is not measured draw or IT load.Original
Google and Intersect Deepen Texas Roots with New Data Center and Energy Investments in Gray and Roberts CountiesIntersect · published or filed Jun 4, 2026 · company · curated facility atlasIntersect’s copy of the June 4, 2026 announcement: Quantum (640 MW solar, 1.3 GWh storage) begins operations in June 2026, the Haskell Google data center recently began construction, and Google closed its acquisition of Intersect in March 2026. Generation operation is not data-center load.Original
Meitner Energy CenterIntersect · retrieved Sep 4, 2026 · company · curated facility atlasLiving portfolio page retrieved September 4, 2026: more than a gigawatt of wind, solar and battery storage in construction in Gray and Roberts Counties, majority clean energy with minority on-site gas firming, and a Google data center to come online alongside the dedicated power. No MW split, COD, or data-center construction record is given.Original
Quantum Clean Energy ProjectIntersect · retrieved Sep 4, 2026 · company · curated facility atlasLiving portfolio page retrieved September 4, 2026: 640 MW PV and 1.3 GWh BESS in Haskell County, in construction with operations beginning June 2026, co-located with a Google data center campus, 1,200 construction and up to 11 permanent jobs. It does not state interconnection, on-site gas MW, or data-center load.Original
Richland Parish data center: Meta officials speak on developments, investmentsKNOE · published or filed May 14, 2025 · journalism · curated facility atlasAttributes an estimate that a portion could be operational in 2028 to Meta regional manager Kevin Janda. It is reported context, not an LPSC-approved service date or a disclosed first-phase capacity.Original
Statement on Otanmäki EIA programKainuu ELY Centre · published or filed Sep 19, 2025 · regulator · curated facility atlasPreserve 40m/20m m³-year conflict and no-final-investment-decision statement.Original
El Gobierno regional aprueba definitivamente la reparcelación del PSI del futuro campus de centros de datos de Meta en Talavera de la ReinaLa Cerca · published or filed Aug 11, 2026 · journalism · curated facility atlasReports the August 11, 2026 announcement by the Consejero de Fomento, a €750 million private investment, 250 direct jobs, and a next stage of construction-project processing and sectoral and municipal authorizations. Announced jobs and investment are not milestones.Original
Lancium Clean Campus for AI Data Centers — AbileneLancium · retrieved Aug 14, 2026 · company · curated facility atlasUndated living page, reviewed on the publication date recorded here.Original
2024 United States Data Center Energy Usage ReportLawrence Berkeley National Laboratory · published Dec 19, 2024 · research · data center primerNational modeled estimates, not an AI-only or facility-meter census.Original
Thailand approves $1.8B hyperscale data center projects in ChonburiLight Reading · published or filed Nov 5, 2024 · journalism · curated facility atlasReports the Quartz Computing approval and an expected early-2027 opening. An expected opening is a forecast, not a milestone.Original
Louisiana Groundwater Management Frequently Asked QuestionsLouisiana Department of Conservation and Energy · retrieved Aug 14, 2026 · regulator · curated facility atlasUndated agency fact sheet reviewed on the recorded date. Outside the Capital Area Ground Water Conservation District, the agency describes its role as notification and registration rather than groundwater-well permitting.Original
Laidley Data Center proposed synthetic minor source air operating permit noticeLouisiana Department of Environmental Quality · published or filed Jun 26, 2026 · regulator · curated facility atlasPublic notice for AI 245583, activity PER20260001, proposed permit 2460-00035-01. A proposed air permit is not a water authorization, operating record, or compute-commissioning record.Original
Water and Biosolids Permit Actions — First Quarter 2026Louisiana Department of Environmental Quality · published or filed Jan 29, 2026 · regulator · curated facility atlasLists general coverage LAG670266 for M. A. Mortenson Company — Laidley Data Center through May 31, 2028. It is not a cooling-water withdrawal authorization or consumption measurement.Original
Order No. U-37425 with Attachment ALouisiana Public Service Commission · published or filed Aug 29, 2025 · regulator · curated facility atlasApproves initial Laidley generation and transmission resources subject to conditions. The public order is not an interval-delivery record and does not unredact the customer load ramp.Original
Order No. U-37882Louisiana Public Service Commission · published or filed May 14, 2026 · regulator · curated facility atlasProcedural order for resources proposed for Evest LLC adjacent to the Laidley facility. It schedules Commission consideration for December 16, 2026 and is not approval of the expanded resources or proof of Hyperion load.Original
Public Redacted Direct Testimony of Joshua B. Thomas — Docket No. U-37425Louisiana Public Service Commission · published or filed Oct 30, 2024 · filing · curated facility atlasThe public version redacts the customer’s initial load, service start, ramp, maximum demand, and related contract terms; no first compute-phase capacity can be recovered from it.Original
Louisiana Revised Statutes § 38:3097.3Louisiana State Legislature · retrieved Aug 14, 2026 · government · curated facility atlasLiving statute reviewed on the recorded date. It governs well notification and registration and allows withdrawal orders in specified circumstances; registration is not measured consumption.Original
January 2025 signed minutesMDEQ Permit Board · published or filed Jan 14, 2025 · regulator · curated facility atlasDated permit-board action for Madison Mega Site, ID 86219, synthetic-minor construction permit 1720-00098.Original
Selayang Municipal Council OSC meeting record No. 37858Malaysia OSC 3 Plus Online · retrieved Aug 14, 2026 · government · curated facility atlasLiving planning record reviewed on the recorded date. It lists SDP EBP Asset I data-center plans including substations, a substation to transfer to TNB, seven water tanks, pump rooms, and a chemical room; it does not establish energization, cooling topology, or consumption.Original
Google's hyperscale data centre at Elmina Business Park breaks groundMalaysian Investment Development Authority · published or filed Oct 2, 2024 · government · curated facility atlasGovernment portal reproducing a New Straits Times report and developer statements.Original
Influence of Chlorination and Choice of Materials on Fouling in Cooling Water System under Brackish Seawater ConditionsMaterials · published Jun 15, 2016 · research · data center primerPeer-reviewed industrial cooling-water study, not a data-center-specific performance study.Original
Protect Our Aquifer: xAI Bought 25M Gallons of Water from MLGW, Projects IncreasesMemphis Flyer · published or filed May 22, 2026 · journalism · curated facility atlasReports March 2026 consumption from MLGW billing records that are not reproduced with the article. The quantity remains reported-from-bills evidence, not a directly inspected invoice or meter record.Original
2025 xAI UpdateMemphis Light, Gas and Water · published or filed May 5, 2025 · utility · curated facility atlasUtility update describes xAI infrastructure, water-service plans, and MLGW/TVA context at the Memphis sites; it does not provide a post-operation facility meter, compute load, or generator allocation.Original
2025 xAI Update — expanded four-page versionMemphis Light, Gas and Water · published or filed May 5, 2025 · utility · curated facility atlasThis official same-date version adds Tulane service details but conflicts with the three-page version on the existing water-main size; neither version reports post-commissioning water consumption.Original
MLGW Statement Regarding the Tulane Road xAI SiteMemphis Light, Gas and Water · published or filed Jul 22, 2025 · utility · curated facility atlasUtility statement reports approximately 0.5 MW of general service at Tulane Road and explicitly excludes supercomputer power; it does not disclose the behind-the-meter generation mix or compute load.Original
xAI and MLGW Quick FactsMemphis Light, Gas and Water · published or filed Jul 31, 2024 · utility · curated facility atlasOriginal
2025 Environmental Data IndexMeta · published or filed Oct 1, 2025 · company · curated facility atlasReports 2024 withdrawal for the pre-existing New Albany facility. It predates Prometheus and is not a Prometheus consumption or phase allocation.Original
Breaking Ground on Our New AI-Optimized Data Center in El PasoMeta · published or filed Oct 15, 2025 · company · curated facility atlasOriginal October 2025 groundbreaking post, updated March 26, 2026 to raise the stated investment from $1.5 billion to more than $10 billion and operational jobs to more than 300. It says the campus can scale to 1 GW, uses a closed-loop liquid-cooled system with zero water for most of the year, and names El Paso Electric as partner. Scalability and matching claims are not load or hourly supply.Original
Building Prometheus: how backend aggregation enables gigawatt-scale AI clustersMeta · published or filed Feb 9, 2026 · company · curated facility atlasDescribes an underway multi-building and colocation cluster intended to reach one gigawatt of compute capacity once complete; no commissioned Prometheus phase is identified.Original
Infrastructure Explained: Compute PowerMeta · published or filed Jun 16, 2026 · company · curated facility atlasDescribes Meta’s diversified global chip portfolio and workloads. It does not establish a site-level NVIDIA, AMD, MTIA, Broadcom, Arm, model, or workload allocation at Hyperion.Original
Infrastructure explained: Meta data centersMeta · published or filed Apr 28, 2026 · company · curated facility atlasDefines Prometheus’s one-gigawatt figure as planned compute capacity, not electrical service, site draw, generation, or current IT load.Original
Meta Partners With Broadcom to Co-Develop Custom AI SiliconMeta · published or filed Apr 14, 2026 · company · curated facility atlasPortfolio-scale MTIA partnership; it does not allocate MTIA hardware to Hyperion.Original
Meta and BlackRock announce El Paso data-center ventureMeta · published Jul 28, 2026 · company · data center primerOriginal
Meta and NVIDIA Announce Long-Term Infrastructure PartnershipMeta · published or filed Feb 17, 2026 · company · curated facility atlasPortfolio-scale Meta infrastructure partnership; it does not allocate an NVIDIA product or quantity to Hyperion.Original
Meta breaks ground in Lebanon, IndianaMeta · published Feb 11, 2026 · company · data center primerOriginal
Meta expands Louisiana data centerMeta · published Jul 13, 2026 · company · data center primerOriginal
Meta nuclear energy projects power American AI leadershipMeta · published or filed Jan 9, 2026 · company · curated facility atlasRegional grid-support contracts and future projects; not onsite generation or exclusive hourly nuclear supply to Prometheus.Original
Meta’s Richland Parish Data CenterMeta · published or filed Dec 4, 2024 · company · curated facility atlasMeta’s current asset page is the stable live entry point. The original 2024 plan described more than 2 GW of compute for training future open-source large language models but did not name a Llama generation, chip model, or first-phase megawatts; archivedUrl preserves that dated document and claim boundary if the live asset is revised.Original Archive
Meta’s infrastructure evolution and the advent of AIMeta · published or filed Sep 29, 2025 · company · curated facility atlasDescribes more than five conventional buildings, weatherproof tent structures, adjacent colocation, and intended Meta AI product workloads.Original
Teachers and Local Businesses Win as Meta Expands Louisiana Data CenterMeta · published or filed Jul 13, 2026 · company · curated facility atlasOriginal
Building Texas — How Meta invests in jobs, infrastructure and communities across the stateMeta Data Centers · retrieved Sep 4, 2026 · company · curated facility atlasLiving overview page retrieved September 4, 2026. It lists Fort Worth as operational since 2017, Temple as under construction after a 2022 groundbreaking with $1.2 billion and about 100 operational jobs once completed, and El Paso as under construction after a 2025 groundbreaking with more than $10 billion, El Paso Electric as partner, $500 million of new generating capacity and $410 million of transmission and grid upgrades. Investment and support-infrastructure figures are not site load.Original
Facebook is joining the Arizona communityMeta Data Centers · published or filed Aug 12, 2021 · company · curated facility atlasGroundbreaking/announcement baseline, not operation.Original
Hello, El Paso!Meta Data Centers · published or filed Oct 15, 2025 · company · curated facility atlasDescribes an almost 1.2 million-square-foot campus, Meta’s 25th U.S. data center, the ability to scale to 1 GW, LEED Gold intent, 200% water restoration, and early planning with El Paso Electric and El Paso Water. It gives no online date or MW by phase.Original
Hello, Kansas City!Meta Data Centers · published or filed Mar 24, 2022 · company · curated facility atlasSite announcement and reported cooling/tariff design only. The $800m-plus investment and approximately 100 jobs were completion forecasts, not spent capital, power or compute capacity.Original
Hello, South Carolina!Meta Data Centers · published or filed Aug 29, 2024 · company · curated facility atlas715,000 ft²/$800m; AI workload intended once operational.Original
Hello, Temple!Meta Data Centers · published or filed Mar 31, 2022 · company · curated facility atlasPlanned ~900,000 ft²/$800m; design/intent only.Original
Kansas City, we are online!Meta Data Centers · published or filed Aug 20, 2025 · company · curated facility atlasDirect traffic-serving milestone. The same page says operational jobs arrive once completed, so live service does not establish full campus buildout; renewable matching is not physical hourly delivery.Original
Kuna, we are online!Meta Data Centers · published or filed Sep 3, 2026 · company · curated facility atlasSays the Kuna Data Center is online and operational, broke ground in 2022, represents more than $1.2 billion, uses a closed-loop liquid-cooled system with zero water for most of the year, matches electricity with renewable energy including 645 MW of Meta-supported Ada County projects, and was planned with Idaho Power. An operating phase is not full buildout, measured load, or workload allocation.Original
Mesa, we are online!Meta Data Centers · published or filed Jan 30, 2025 · company · curated facility atlasDirect live-traffic milestone; partial phase possible.Original
Mesa, we're growing!Meta Data Centers · published or filed May 4, 2022 · company · curated facility atlasExpansion/construction claim, not full-build completion.Original
Meta Kuna Data Center info sheetMeta Data Centers · retrieved Sep 4, 2026 · company · curated facility atlasUndated info sheet retrieved September 4, 2026: $1.2 billion-plus investment, 2022 groundbreaking, about 100 operational jobs once completed, 1,600 peak construction workers, a $100 million water and wastewater system given to the City of Kuna, and a closed-loop liquid-cooled system. “Once completed” confirms the campus is not treated as fully built.Original
Ramping up construction on Temple Data CenterMeta Data Centers · published or filed Oct 12, 2023 · company · curated facility atlasConstruction and AI-supporting design; not live traffic.Original
The largest Meta data center yet brings big impact to LouisianaMeta Data Centers · retrieved Aug 14, 2026 · company · curated facility atlasLiving facility page reviewed on the recorded date. It identifies Hyperion, 5 GW of planned compute, and a closed-loop glycol system with dry cooling for most of the year; it supplies no meter data or first-phase capacity.Original
US locations / MesaMeta Data Centers · retrieved Aug 15, 2026 · company · curated facility atlasLiving portfolio/location page; use only dated facts with retrieval basis.Original
Building PrometheusMeta Engineering · published Feb 9, 2026 · company · data center primerOriginal
Building efficient data centers with the Open Compute ProjectMeta Engineering · published Apr 7, 2011 · company · data center primerOriginal
Meta Announces New Strategic Venture with BlackRock to Develop Data Center in El PasoMeta Investor Relations · published or filed Jul 28, 2026 · company · curated facility atlasFunds managed by BlackRock take 80% and Meta 20% of a venture to develop and own the campus, which is described as currently under construction with about $14 billion of development cost, $12.5 billion of debt financing, 1 GW of compute capacity, and capacity expected to begin coming online in 2028; Meta is construction and property manager and initial sole occupant under leases with a four-year initial term. A financing structure is not energization or compute.Original
Claim of appeal and exhibitsMichigan Attorney General · published or filed Apr 17, 2026 · filing · curated facility atlasAppeal filing; no inferred stay/vacatur.Original
MPSC rejects rehearing effortMichigan Attorney General · published or filed Mar 27, 2026 · government · curated facility atlasRehearing denial; underlying approval remains unless stayed/reversed.Original
Petition for rehearing on DTE data-center contractsMichigan Attorney General · published or filed Jan 9, 2026 · government · curated facility atlasProcedural challenge; not a stay.Original
AG Nessel Files Appeal of MPSC Approval of DTE’s Saline Data Center ContractsMichigan Department of Attorney General · published Apr 17, 2026 · government · data center primerRecords the filing of an appeal; it does not establish that a court has stayed or vacated the MPSC order.Original
AG Nessel files appeal of MPSC approval of DTE’s Saline data center contractsMichigan Department of Attorney General · published or filed Apr 17, 2026 · government · curated facility atlasEstablishes that an appeal was filed; it does not establish a stay, reversal, or final disposition.Original
Public notice: draft permit MI0060445, Related Digital Wastewater Treatment PlantMichigan Department of Environment, Great Lakes, and Energy · published or filed Jul 23, 2026 · regulator · curated facility atlasDraft permit for treated domestic wastewater to the Saline River. It is not a final permit and does not authorize cooling-water discharge.Original
Issue brief U-21990, DTE data-center contractsMichigan PSC · published or filed Dec 18, 2025 · regulator · curated facility atlasRegulator summary; approval/service terms not actual load.Original
DTE Electric application and testimony in Case U-21990Michigan Public Service Commission · published or filed Nov 3, 2025 · regulator · curated facility atlasThe public filing identifies Green Chile Ventures as an Oracle subsidiary and gives a planned 1.4 GW load ramp; contract exhibits remain partly redacted.Original
MPSC approves DTE Electric energy contracts for data center with conditionsMichigan Public Service Commission · published or filed Dec 18, 2025 · regulator · curated facility atlasConditional approval for 1,383 MW of contracted demand; this is neither operating load nor IT capacity.Original
MPSC approves DTE Electric energy contracts for data center with conditions to strengthen protections for other customersMichigan Public Service Commission · published Dec 18, 2025 · regulator · data center primerOriginal
MPSC goes big on batteries, approving six energy storage contracts totaling 1,332 megawattsMichigan Public Service Commission · published or filed Mar 27, 2026 · regulator · curated facility atlasApproves the first 332 MW of a customer-funded 1,383 MW storage portfolio. Grid-owned storage is not a dedicated physical electricity path to the campus.Original
From Wisconsin to Atlanta: Microsoft connects datacenters to build its first AI superfactoryMicrosoft · published or filed Nov 12, 2025 · company · curated facility atlasSays the Atlanta Fairwater site began operating in October 2025, uses NVIDIA GB200 NVL72 rack-scale systems, fills its closed loop once with water equal to about 20 homes’ annual use, and connects to Wisconsin by dedicated fiber. Workloads are named only at fleet level (OpenAI, Microsoft AI Superintelligence Team, Copilot); no address, MW, or customer allocation is disclosed.Original
Infinite scale: The architecture behind the Azure AI superfactoryMicrosoft · published or filed Nov 12, 2025 · company · curated facility atlasDescribes the Fairwater Atlanta design: closed-loop liquid cooling reused after an initial fill, a grid-only power design that forgoes on-site generation, UPS and dual-corded distribution for the GPU fleet, roughly 140 kW racks of NVIDIA Blackwell GPUs, and an AI WAN to Wisconsin. It discloses no facility MW, utility, meter, address, or operational date.Original
Inside the world’s most powerful AI datacenterMicrosoft · published or filed Sep 18, 2025 · company · curated facility atlasCompany engineering description of GB200 systems, frontier training and inference, and closed-loop cooling. “Hundreds of thousands” is not encoded as an exact GPU count.Original
Made in Wisconsin: the world’s most powerful AI datacenterMicrosoft · published or filed Sep 18, 2025 · company · curated facility atlasDescribes energy prepayment and annual carbon-free matching; the Portage County solar project is portfolio/accounting context, not proven physical or hourly Fairwater delivery.Original
Maia 200: The AI accelerator built for inferenceMicrosoft · published or filed Jan 26, 2026 · company · curated facility atlasEstablishes Microsoft as a first-party AI-accelerator designer; it does not establish chip allocation at any facility in this dataset.Original
Microsoft and OpenAI extend partnershipMicrosoft · published or filed Jan 23, 2023 · company · curated facility atlasOriginal
Microsoft completes construction on first datacenter facility in Mount Pleasant, WisconsinMicrosoft · published or filed Jun 23, 2026 · company · curated facility atlasConfirms the first facility is fully operational and an adjacent similar-scale facility remains under construction for scheduled 2028 completion.Original
Microsoft completes first Fairwater data-center facilityMicrosoft · published Jun 23, 2026 · company · data center primerOriginal
Project NatickMicrosoft · updated Sep 14, 2020 · company · data center primerA controlled subsea research module, not a commercial fleet deployment.Original
Second construction phase in Helsinki-region campusesMicrosoft · published or filed Apr 28, 2026 · company · curated facility atlasPhase schedule and stated permits; commissioning follows construction.Original
Spain AI/cloud infrastructure investmentMicrosoft · published or filed Feb 20, 2024 · company · curated facility atlasPortfolio intent; no campus allocation.Original
Vihti project overviewMicrosoft Local · retrieved Aug 15, 2026 · company · curated facility atlasLiving construction page; preconstruction Sept 2024 and contractor changes.Original
Stakeholder Process Voting ListMidcontinent Independent System Operator · published or filed Apr 7, 2026 · grid operator · curated facility atlasLists WEC Energy Group and Wisconsin Electric Power Company in MISO’s stakeholder process. It establishes regional membership context, not Fairwater’s settlement node, load-zone allocation, meter, or delivered generation.Original
Proyecto Google Datacenter — environmental assessment docketMinistry of Environment of Uruguay · retrieved Aug 14, 2026 · regulator · curated facility atlasLiving Project Teros docket reviewed on the recorded date. It links the assessment, final report, and Resolution 644-2024 and describes UTE supply and air cooling; it is not an operating meter or commissioning record.Original
MZX Tech LLC — Facility Details, AI 12592Mississippi Department of Environmental Quality · retrieved Aug 14, 2026 · regulator · curated facility atlasLiving regulator record reviewed on the recorded date. It lists the active PSD construction permit, construction-stormwater coverage, and receipt of a pretreatment application; an application receipt is not an issued water permit.Original
AWS planned $10b investmentMississippi Development Authority · published or filed Jan 25, 2024 · government · curated facility atlasTwo-complex portfolio announcement; not site capacity.Original
Amazon plans $3b Vicksburg investmentMississippi Development Authority · published or filed Nov 20, 2025 · government · curated facility atlasConstruction expected 2026; expectation only.Original
FY2024 incentives reportMississippi Development Authority · retrieved Aug 15, 2026 · government · curated facility atlasRetrieved-date basis; FY2024 snapshot: bonding authority and then-$0 spent/0 jobs; not current status.Original
Air Pollution Control Permit and PSD Authority to Construct — Permit No. 0680-00119Mississippi Environmental Quality Permit Board · published or filed Mar 11, 2026 · regulator · curated facility atlasAuthorizes construction of 41 stationary simple-cycle turbines at the separate Southaven power site. Operation requires construction certification, which this permit alone does not establish.Original
House weekly summary, week of Jan. 22Mississippi Legislature · published or filed Jan 26, 2024 · government · curated facility atlasProject Atlas/two complexes/incentive legislation; no facility completion.Original
Montana-Dakota Utilities Announces Electric Service Agreement with Applied Digital for Proposed AI FactoryMontana-Dakota Utilities · published or filed Jun 22, 2026 · utility · curated facility atlasUtility release for a separate Polaris Forge 3 agreement that also states Montana-Dakota Utilities currently serves Applied Digital at Polaris Forge 1 near Ellendale and has credited $38.4 million to North Dakota customers over three years. It does not disclose the Ellendale service agreement, MW, or interval load.Original
Abilene Data Center DevelopmentMortenson · retrieved Aug 14, 2026 · company · curated facility atlasLiving project page reviewed on the recorded date. It reports the 345 kV expansion and 1 GW customer substation fully energized on March 10, 2026; an energized rating is not delivered load.Original
IM3 Data Center AtlasMultiSector Dynamics-Living, Intuitive, Value-adding, Environment · data release Feb 9, 2026 · research · data center primerA separate cleaned public atlas used as a comparison, not silently merged into the OSM snapshot.Original
Second-phase building permit pendingMunicipality of Kirkkonummi · published or filed Mar 14, 2025 · government · curated facility atlasHEL04 granted; HEL05–06 application pending at publication.Original
2024 annual report and financial statementsMunicipality of Muhos · published or filed Mar 24, 2025 · government · curated facility atlasAdoption date; zoning and Google investment decision pending.Original
Public EIA session noticeMunicipality of Muhos · published or filed Apr 29, 2026 · government · curated facility atlasExplicitly says final investment decision not made.Original
€26m land-use agreement with Tuike Finland OyMunicipality of Muhos · published or filed Feb 26, 2026 · government · curated facility atlasDated municipal agreement; it does not equal a final investment or build decision.Original
Land purchases for future cloud/data-center expansionMunicipality of Muhos / Google · published or filed Nov 28, 2024 · government · curated facility atlasOne source may support Kajaani and Muhos; land purchase is not build decision.Original
Data-center cornerstone laidMunicipality of Vihti · published or filed May 23, 2025 · government · curated facility atlasCeremonial/construction milestone, not operation.Original
Huhmari data-center building permitMunicipality of Vihti · published or filed Mar 13, 2026 · government · curated facility atlasIncludes right to commence; not completion.Original
Appeal of Air Permit No. 01156-01PC with appendicesNAACP and Young, Gifted & Green · published or filed Jul 16, 2025 · filing · curated facility atlasThis primary administrative filing quotes and challenges Shelby County Permit 01156-01PC and preserves its permit lineage and appendices. The regulator’s original document-center URL returned 404 on 2026-08-14. The permit materials cover 15 Solar SMT-130 turbines totaling 247.2 MW; permitted nameplate is not operating load.Original
Request for Formal Hearing Regarding MZX Tech LLC Permit No. 0680-00119NAACP, Young Gifted & Green, and Safe and Sound Coalition · published or filed Apr 9, 2026 · filing · curated facility atlasPrimary administrative filing mirrored by Mississippi Today. It records a challenge, not a stay, vacatur, or final adjudication.Original
36 backup generators, building 1 (case 25777)NVE · published or filed Sep 9, 2025 · regulator · curated facility atlasPermit/nameplate only.Original
Electrical facilities for building 2 (case 25885)NVE · published or filed Jan 28, 2026 · regulator · curated facility atlasAuthorization only.Original
Gromstul electrical authorizationNVE · published or filed Nov 4, 2024 · regulator · curated facility atlasDated authorization for two 120-MVA transformers and a 132-kV cable; no MW conversion.Original
Temporary construction power, building 1 (case 17212)NVE · published or filed Apr 19, 2024 · regulator · curated facility atlasConstruction supply only; not ordinary service or compute.Original
Deutsche Telekom and NVIDIA launch Industrial AI Cloud — a new era for Germany’s industrial transformationNVIDIA · published or filed Nov 4, 2025 · company · curated facility atlasVendor blog naming DGX B200 systems, RTX PRO servers, up to 10,000 NVIDIA GPUs in German data centers, and early-2026 availability, plus intended customers. It does not name Munich or Polarise and is not an installation record.Original
NVIDIA Guarantees SB Energy’s PORTS-Pike Technology Campus in Ohio to Exclusively Host NVIDIA AI ComputeNVIDIA · published or filed Aug 17, 2026 · company · curated facility atlasStates that OpenAI will be the customer under a 20-year lease, that SB Energy will build, own and operate the campus, that NVIDIA provides credit support for an initial 4.25 GW-IT with an option on 3.75 GW-IT and invests $1.5 billion in SB Energy, and that capacity is expected to come online in phases beginning in 2028. Announced tranches are not construction or delivered compute.Original
NVIDIA and CoreWeave Strengthen Collaboration to Accelerate Buildout of AI FactoriesNVIDIA · published or filed Jan 26, 2026 · company · curated facility atlasOriginal
NVIDIA and Partners Build America's AI InfrastructureNVIDIA · published or filed Oct 28, 2025 · company · curated facility atlasOriginal
NBS Builds a ComputerNational Institute of Standards and Technology · accessed Aug 13, 2026 · government · data center primerOriginal
Nebius and Bloom Energy partner to power AI infrastructure build-outNebius · published or filed May 20, 2026 · company · curated facility atlasAnnounces a long-term partnership for behind-the-meter Bloom fuel-cell electricity and says 328 MW of installed capacity is expected to be operational in 2026 across Nebius sites. It does not name Vineland, allocate MW to it, or establish fuel-cell operation.Original
Nebius announces multi-billion dollar agreement with Microsoft for AI infrastructureNebius · published or filed Sep 8, 2025 · company · curated facility atlasSays Nebius will deliver dedicated capacity to Microsoft from its new Vineland, New Jersey data center starting later in 2025 under a multi-year agreement. No MW, ownership, or construction status is stated, and later company material moved operations to 2027.Original
Nebius x Vineland, New JerseyNebius · retrieved Sep 4, 2026 · company · curated facility atlasLiving project page retrieved September 4, 2026. It describes DataOne as developer with Nebius as tenant, on-site off-grid power from Bloom Energy fuel cells, closed-loop cooling with a one-time fill of about 1 million gallons and annual use of roughly seven Olympic pools, operations expected by 2027, about 200 permanent jobs, and a five-year PILOT approved in January 2026. It does not state MW or an energization date.Original
Nebius Group N.V. Form 6-K, Exhibit 99.1Nebius Group via U.S. Securities and Exchange Commission · published or filed Sep 8, 2025 · filing · curated facility atlasThe filed copy of the Microsoft announcement. It repeats the Vineland dedicated-capacity language without contract value, MW, or site status.Original
YGI Microgrid Air Quality Permit ApplicationNew Mexico Environment Department · published or filed Apr 27, 2026 · filing · curated facility atlasApplication proposes 2,275 solid-oxide fuel-cell units and up to 2,462 MW of onsite nameplate generation. An application is not an issued air permit, a grid interconnection, critical-IT load, or operating generation.Original
Construction Permits Under Review — YGI Microgrid NSR 10883New Mexico Environment Department Air Quality Bureau · retrieved Aug 14, 2026 · regulator · curated facility atlasLiving permit-status page reviewed on the recorded date. It lists YGI LLC application NSR 10883 as under review, not issued; the public-review deadline is a procedural milestone, not permission to construct or operate.Original
Changes to the Skoglund 420 kV substation projectNordkraft Industrinett filing with the Norwegian Water Resources and Energy Directorate · published or filed Dec 22, 2025 · filing · curated facility atlasStates that data-center construction was underway, expected electric consumption was 230 MW from the existing Skoglund station, and a further 290 MW request was in Statnett’s reservation queue. Expected use and a queue position are not live demand or approved expansion.Original
Authority statement on Muhos EIA programNorth Ostrobothnia ELY Centre · published or filed Nov 28, 2025 · regulator · curated facility atlasNo final investment decision; water/air alternatives and cumulative concerns.Original
Licence for the Skoglund 420 kV substation and grid connectionNorwegian Water Resources and Energy Directorate · published or filed Mar 11, 2026 · regulator · curated facility atlasAuthorizes Nordkraft Industrinett to build, own, and operate customer-specific grid facilities connected to Statnett’s Kvandal station and records 230 MW of reserved withdrawal. A licence and reservation do not establish energization, meter demand, or generation source.Original
Nscale and Nordkraft enter strategic partnership to support data center operations in NarvikNscale · published or filed Jul 6, 2026 · company · curated facility atlasNscale says Nordscale Operations AS is owned 51% by Nscale Norway and 49% by Nordkraft and will manage Narvik facilities. It also describes Nordkraft construction-phase operational services since 2025 and a 2026 company-operations target. Corporate operations and facility-management activity are not energization, customer acceptance, or operating compute.Original
Nscale announces expanded deal with Microsoft in NorwayNscale · published or filed Apr 14, 2026 · company · curated facility atlasSays the 230 MW Narvik campus will add more than 30,000 NVIDIA Rubin GPUs for Microsoft in 2027 and will be solely managed by Nscale. This is contracted/planned deployment, not installed inventory or operating compute.Original
Nscale signs multi-year agreements with Microsoft for ~200,000 NVIDIA GB300 GPUsNscale · published or filed Oct 15, 2025 · company · curated facility atlasStates that from Q1 2026 Nscale will deliver approximately 12,600 NVIDIA GB300 GPUs at the Start Campus data centre in Sines under a multi-year agreement with Microsoft. A delivery commitment is not an acceptance, energization, or workload record.Original
Nscale to deliver 66,000+ NVIDIA Rubin GPUs to Microsoft at Start Campus’ site in PortugalNscale · published or filed May 5, 2026 · company · curated facility atlasSays the agreement builds on the deployment of over 12,600 Blackwell Ultra GPUs at the first building and adds 66,000+ Rubin GPUs starting in late 2027, €230 million of shared infrastructure, and €465 million for a second 200 MW building. Company wording about a prior deployment is not an independent commissioning record; Rubin figures are future commitments.Original
Governor Stein Announces Amazon Plans to Invest $10 Billion in North Carolina for AI InfrastructureOffice of the Governor of North Carolina · published or filed Jun 4, 2025 · government · curated facility atlasState announcement of a $10 billion cloud and AI campus in Richmond County with at least 500 jobs. It names no acreage, utility, permit, MW, or construction date.Original
Ohio Power Siting Gas Generation and CHP Case StatusOhio Power Siting Board · published or filed Jul 23, 2026 · regulator · curated facility atlasThe official PDF says “As of 7/23/2026” and “Map produced on 7/23/2026” but places Socrates South in its operational table with an 8/3/26 date. That internally future-dated entry is contradictory status evidence, not commissioning proof.Original
OpenAI signs on for Pike County AI campus, commits $164 million for Ohio programsOhio Tech News · published or filed Aug 17, 2026 · journalism · curated facility atlasReports the 8 GW-IT, 20-year arrangement, an 800 MW tranche expected in 2028, private property plus remediated DOE-controlled land near the former Portsmouth Gaseous Diffusion Plant, and the $80 million community fund plus up to $84 million in student credits. It is secondary to the company releases and does not establish permits or construction.Original
Announcing The Stargate ProjectOpenAI · published or filed Jan 21, 2025 · company · curated facility atlasIdentifies the initial equity funders, lead responsibilities, and technology partners.Original
Building the compute infrastructure for the Intelligence AgeOpenAI · published Apr 29, 2026 · company · data center primerSupports that the Abilene site was operating by this date; it does not report current site load.Original
Building the compute infrastructure for the intelligence ageOpenAI · published or filed Apr 29, 2026 · company · curated facility atlasConfirms that Abilene runs NVIDIA GB200 systems and was used to train GPT-5.5; it does not publish installed rack, accelerator, or chip counts.Original
Building the infrastructure for the Intelligence Age in MichiganOpenAI · published or filed Jun 1, 2026 · company · curated facility atlasConfirms groundbreaking and describes a 1 GW campus. The cooling and ratepayer statements are company claims, not operating measurements.Original
Introducing Stargate NorwayOpenAI · published or filed Jul 31, 2025 · company · curated facility atlasOriginal announcement of an intended OpenAI anchor, 50/50 Aker–Nscale ownership structure, 230 MW first build, and 100,000-GPU target. Later Aker and Nscale disclosures say the venture was rolled into Nscale and Microsoft replaced the OpenAI letter of intent, so this is historical plan evidence rather than current offtake or ownership.Original
Introducing Stargate UAEOpenAI · published or filed May 22, 2025 · company · curated facility atlasAnnounces a 1 GW partnership and 200 MW 2026 target but does not allocate legal ownership, operation, a chip order, utility service, or measured resource use among the named partners.Original
Introducing Stargate UKOpenAI · published or filed Sep 16, 2025 · company · curated facility atlasDescribes only exploratory multi-site GPU offtake. OpenAI later paused Stargate UK; neither 8,000 nor 31,000 GPUs was allocated to Cobalt Park in this announcement.Original
OpenAI, Oracle, and SoftBank expand Stargate with five new AI data center sitesOpenAI · published or filed Sep 23, 2025 · company · curated facility atlasMost numerical claims cover several sites together and must not be apportioned.Original
Stargate CommunityOpenAI · published or filed Jan 20, 2026 · company · curated facility atlasNames development, utility, cooling-design, and community commitments; it is not metered telemetry.Original
Stargate Michigan data center breaks groundOpenAI · published Jun 1, 2026 · company · data center primerOriginal
Stargate advances with 4.5 GW partnership with OracleOpenAI · published or filed Jul 22, 2025 · company · curated facility atlasDistinguishes live portions of Abilene from additional capacity under development.Original
Stargate and SB Energy partnershipOpenAI · published Jan 9, 2026 · company · data center primerOriginal
Project CamelliaOpenAI (projectcamellia.com) · retrieved Sep 4, 2026 · company · curated facility atlasLiving project site retrieved September 4, 2026. OpenAI says it is contracting with Georgia Power for 3.2 GW to be delivered in phases between 2028 and 2032, will pay full energy costs, and will minimize water through closed-loop cooling. It names no acreage, permit, or construction date.Original
OpenStreetMap Copyright and LicenseOpenStreetMap Foundation · accessed Aug 13, 2026 · community data · data center primerOriginal
Tag: telecom=data_centerOpenStreetMap Wiki · updated Jul 10, 2026 · community data · data center primerOriginal
AI Data Centers: Investing in Communities, Powering the FutureOracle · retrieved Aug 14, 2026 · company · curated facility atlasLiving page reviewed on the recorded date. Oracle reports 42% of Abilene capacity delivered and says Port Washington customer delivery begins in the second half of 2027; neither statement is a regulator-approved in-service date or measured load.Original
Oracle, BorderPlex, and Bloom Energy to Power Project Jupiter with Fuel Cell TechnologyOracle · published or filed Apr 27, 2026 · company · curated facility atlasCompany announcement replaces the earlier turbine concept with up to 2.45 GW of planned Bloom Energy fuel cells. A design change and nameplate plan do not establish permit issuance or operation.Original
Project Jupiter Water FactsOracle · published or filed Apr 27, 2026 · company · curated facility atlasCompany design disclosure distinguishes public drinking water for offices from contracted non-potable industrial-well water, describes direct-to-chip closed-loop non-evaporative cooling, and gives a one-time fuel-cell fill estimate. None is measured operating consumption.Original
Vantage gets DNR permit to use private wellsOzaukee Press · published or filed Jul 28, 2026 · journalism · curated facility atlasReports temporary-well pumping caps of 20, 20, 20, and 30 gallons per minute. The underlying DNR permit number was not recovered for direct review, so the 90-gpm sum remains reported permit context rather than encoded consumption.Original
Polarise supports the rapid launch of Deutsche Telekom’s Industrial AI Cloud in MunichPolarise · published or filed Feb 4, 2026 · company · curated facility atlasPolarise describes itself as the data-center partner providing and operating the brownfield facility for up to 10,000 GPUs and over 0.5 EFLOPS. It discloses no MW or cooling capacity.Original
Eldorado do Sul assina protocolo de intenções junto à Scala Data Centers para construção da Scala AI CityPrefeitura de Eldorado do Sul · published or filed Nov 13, 2024 · government · curated facility atlasMunicipal record of a protocol of intent with an initial R$3 billion investment and about 3,000 jobs. A protocol of intent is not a licence, construction start, or grid contract.Original
Orsi visitó obra del centro de datos de Google en Uruguay y valoró vínculo laboral entre empresas y trabajadoresPresidency of Uruguay · published or filed Apr 14, 2026 · government · curated facility atlasDirect government account describing the facility as under construction during the site visit. The source title is preserved in Spanish; it is updated status evidence, not a module commissioning or first-load record.Original
Resolution No. 65/024 — expansion of Parque de las Ciencias free-zone areaPresidency of Uruguay · published or filed Feb 28, 2024 · government · curated facility atlasOfficial Presidency publication dated February 28, 2024, of Resolution 65/024 identifying Eleanor Applications S.R.L. as owner of the parcels added to the free-zone area. It replaces a now-unresolvable IMPO endpoint whose gazette record was dated March 8. Parcel ownership does not establish Google’s corporate relationship to Eleanor or a commissioned facility.Original
Final Decision — Very Large Customer and Bespoke Resources tariffsPublic Service Commission of Wisconsin · published or filed May 21, 2026 · regulator · curated facility atlasPSC docket 6630-TE-113, REF#591873. Approves tariff rules for qualifying customers, not Port Washington construction, facility megawatts, a service contract, or an in-service date.Original
Ozaukee County Distribution Interconnection ProjectPublic Service Commission of Wisconsin · retrieved Aug 14, 2026 · regulator · curated facility atlasLiving docket page reviewed on the recorded date. PSC docket 137-CE-221 remained under review; applicant schedule is not an approved or actual in-service date.Original
Ohio approves Socrates North generation facilityPublic Utilities Commission of Ohio / Ohio Power Siting Board · published or filed May 21, 2026 · regulator · curated facility atlasApproves a 200-MW non-grid-connected behind-the-meter gas plant for Sidecat; approval is not Prometheus supply allocation or operation.Original
AEP Texas North Division Construction Progress Report — August 2023Public Utility Commission of Texas · published or filed Aug 1, 2023 · filing · curated facility atlasPUCT Project No. 54468, item 244. The month-only report date is normalized to month start. Projects T10433134/P21743001 and T10434308/P21743002 identify SCADA, metering at the Lancium terminal, and the 138 kV tie for a 200 MW data center, energized June 30, 2023.Original
AEP Texas North Division Construction Progress Report — May 2025Public Utility Commission of Texas · published or filed May 1, 2025 · filing · curated facility atlasPUCT Project No. 57477; the month-only report date is normalized to month start. It documents the later Lancium transmission expansion, but project ratings and schedules are not meter demand.Original
Pure DC launches one of Europe’s largest ever AI infrastructure projectsPure Data Centres Group · published or filed Jul 14, 2026 · company · curated facility atlasAnnounces a 110 MW phase 1 with over €1.5 billion of investment on a 370-acre Seinäjoki site scalable to 550 MW+, access to more than 700 MVA of renewable power, phase 1 fully leased, a constructed and live substation for the first data hall, closed-loop cooling with zero water use in operation, and 40 MW modules. Company claims of secured permissions and leasing are not independent permit, tenant, or construction records.Original
Saudi’s Humain to launch data centers with US chips in early 2026Reuters (via Yahoo Finance) · published or filed Aug 25, 2025 · journalism · curated facility atlasReports, citing a Bloomberg interview, that HUMAIN planned data centers in Riyadh and Dammam of up to 100 MW each targeting Q2 2026, with an initial 18,000 Blackwell chips. Targets relayed through journalism are not commissioning records and the two sites cannot be separated from later live-cluster claims.Original
How much water will data center use?Richland Today · published or filed Jan 1, 2026 · journalism · curated facility atlasState-record-based reporting describes more than 23 MGD of registered initial pumping capacity and a 500–600-million-gallon annual forecast beginning in 2028. Neither value is measured consumption, and the forecast predates the 5 GW expansion. The article URL returned 404 on 2026-09-04 and no archived copy was located, so the figures are retained only as previously reviewed reported context pending recovery from the publisher or the underlying Louisiana DCE well records.Original
AWS Comes to Richmond CountyRichmond County Economic Development · retrieved Sep 4, 2026 · government · curated facility atlasLiving county economic-development page retrieved September 4, 2026. It says the Energy Way site near Hamlet is zoned heavy industrial, will be powered by Duke Energy, will source all water from the county system’s verified excess capacity with use expected less than 7% of the year, that site preparation would begin by the end of 2025, and that data-center hiring was expected around November 2026. It is not a permit, meter, or construction record.Original
Amazon to bring jobs, infrastructure improvements to Richmond County with data center projectRichmond Observer · published or filed Jun 5, 2025 · journalism · curated facility atlasReports the June 4, 2025 announcement: 20 buildings of 200,000–250,000 square feet at Energy Way Industrial Park across from Duke Energy’s 820 MW Smith Energy Complex, an incentive agreement requiring at least 50 jobs and $1 billion of investment by the end of 2030, about $35 million of water and sewer work, and an AWS statement that construction would start within weeks. Stated intent is not a mobilization record.Original
Riot Platforms Reports Second Quarter 2026 Financial Results (Exhibit 99.1)Riot Platforms via U.S. Securities and Exchange Commission · published or filed Aug 10, 2026 · filing · curated facility atlasAnnounces a 20-year, $9.1 billion lease of a 191 MW critical-IT build-to-suit Tier 3 data center at the Rockdale campus to “one of the world’s leading frontier AI labs”, with 96 IT MW expected in December 2027, full 191 IT MW by June 2028, use of the campus’s existing approved interconnection, and a $573 million Morgan Stanley interim facility. The tenant is not named and no building permit or construction milestone is disclosed.Original
NVIDIA Secures AI Compute at PORTS-Pike Technology CampusSB Energy · published or filed Aug 17, 2026 · company · curated facility atlasSB Energy’s companion release: 4.25 GW-IT initial deployment, 8 GW-IT planned, at least 10 GW of new generation, a $4.2 billion AEP Ohio grid partnership, private and federal land, and an $80 million community fund. Generation and transmission commitments are plans, not energized supply.Original
Ohio Leaders Welcome PORTS-Pike Technology CampusSB Energy · published or filed Aug 18, 2026 · company · curated facility atlasCollects statements from federal, state and Pike County officials and confirms the $80 million community benefits total. It contains no permit, construction, or first-phase MW record.Original
OpenAI and SoftBank Group Partner with SB EnergySB Energy · published or filed Jan 9, 2026 · company · curated facility atlasCompany announcement says OpenAI signed a 1.2 GW, 15-year data-center lease for the Milam initial buildout and that SB Energy will build and operate the campus. Contracted capacity is not energized load.Original
Orion I, Orion II, and Orion IIISB Energy · retrieved Aug 14, 2026 · company · curated facility atlasLiving project page reviewed on the recorded date. It identifies Google’s Midlothian data center as anchor customer for the separate 900 MWdc Orion solar portfolio; that portfolio must not be assigned to OpenAI’s Milam campus.Original
SB Energy Publicly Files Registration Statement for Proposed IPOSB Energy · published or filed Sep 1, 2026 · company · curated facility atlasDates the public S-1 filing to September 1, 2026. It adds no campus, permit, or construction fact.Original
PORTS-Pike Technology CampusSB Energy / SoftBank (portscampus.com) · retrieved Sep 4, 2026 · company · curated facility atlasLiving project site retrieved September 4, 2026. It describes a 10 GW campus on private and remediated DOE land, 9.2 GW of natural-gas generation, an 800 MW first phase, a planned 2026 construction start, 765 kV transmission, and 35,000 construction and 2,500 operating jobs. Planned figures are not construction, permits, or operation.Original
SB Energy, Inc. Form S-1 registration statementSB Energy via U.S. Securities and Exchange Commission · published or filed Sep 1, 2026 · filing · curated facility atlasDefines the PORTS-Pike campus as 17 buildings aggregating about 8.0 GW-IT, says the company has executed a definitive lease for it but it is not yet under construction, tables Buildings 1–9 (4,248 MW-IT, last RFS 2031) and 10–17 (3,776 MW-IT, 2032) with 9.2 GW of utility service agreements subject to final approvals and gas generation not yet financed or built, and states that no SB Energy data-center capacity is in operation. It also lists Milam County Buildings 1 (308 MW-IT) and 2 (445 MW-IT) under construction with RFS in 2028 and OpenAI as the Milam and PORTS customer.Original
SK Group and AWS team up to build cloud computing infrastructure to support AI innovationSK Group · retrieved Sep 4, 2026 · company · curated facility atlasLiving company news page retrieved September 4, 2026 describing the June 2025 Ulsan partnership, operations scheduled to begin by 2027, a 15-year partnership, hybrid air-and-liquid cooling, and future floating offshore wind. It gives no MW, GPU count, or construction record.Original
SK Group partners with OpenAI to advance global AI infrastructureSK Group · published or filed Oct 1, 2025 · company · curated facility atlasRecords an SK Telecom MOU with OpenAI to collaborate on an AI data center in the southwest region of Korea as part of “Stargate Korea” and an SK hynix HBM supply intention of up to 900,000 DRAM wafers per month. The MOU names no site, MW, owner, or date.Original
SK Telecom accelerates expansion of its AI data center initiativeSK Telecom · published or filed Nov 3, 2025 · company · curated facility atlasStates a plan to expand the Ulsan AIDC to 1 GW-scale capacity, an R&D partnership with AWS, and use of an LNG power plant with integrated cooling in collaboration with SK Innovation. A 1 GW plan and an energy concept are not built capacity or a delivered supply record.Original
SK-AWS Ulsan AI Data Center to be key hub of AI superhighwaySK Telecom newsroom · retrieved Sep 4, 2026 · company · curated facility atlasLiving newsroom page retrieved September 4, 2026 recording a June 20, 2025 launch ceremony and describing a hyperscale facility among the largest in Korea. Ceremony language is not construction, energization, or compute.Original
STACK Infrastructure Delivers Digital Infrastructure for Data Center Campus in New MexicoSTACK Infrastructure · published or filed Sep 26, 2025 · company · curated facility atlasCompany announcement describes more than one gigawatt of planned AI-workload capacity, an onsite microgrid, and closed-loop cooling. It is not an issued power permit or operating record.Original
Salem Township Board of Supervisors meeting minutesSalem Township · published or filed Mar 10, 2026 · government · curated facility atlasDocuments active AWS construction and four planned fan-cooled buildings; it does not establish compute commissioning.Original
Data Center UpdateSaline Township · retrieved Aug 14, 2026 · government · curated facility atlasLiving township page reviewed on the recorded date; it separates construction dewatering, monitoring wells, utilities, foundations, and operating plans.Original
Saline Township Data Center: Project Information and Frequently Asked QuestionsSaline Township · published or filed Jan 28, 2026 · government · curated facility atlasTownship summary of governing documents and then-current plans; anticipated water use is not a permit limit or meter reading.Original
Saline Township Planning Commission meeting minutes — August 5, 2025Saline Township · published or filed Aug 5, 2025 · government · curated facility atlasRecords applicant statements that the design would not use water cooling, would rely on onsite wells, and was then estimated at roughly 28,000 gallons per day. It is a planning estimate, not measured use.Original
Scala AI City: Brazil’s Ministry of Mines and Energy approves 5 GW power connection for data-center city in Rio Grande do SulScala Data Centers (via PR Newswire) · published or filed May 14, 2025 · company · curated facility atlasCompany release reporting a Ministry of Mines and Energy approval of a 5 GW connection to the national system, a 4.75 GW full-campus figure on 10 million m², and a 54 MW first phase for R$3 billion. The underlying ministerial instrument is not reproduced, and an approved connection is not built transmission, energization, or load.Original
Cerrillos judgment summarySecond Environmental Court · published or filed Feb 27, 2024 · government · curated facility atlasExplains water-to-air proposal; pertinence is not binding original evaluation.Original
Judgment R-271/R-270-2020Second Environmental Court · published or filed Feb 26, 2024 · filing · curated facility atlasPartial annulment due water/climate evaluation deficiency; execution suspended pending complementary RCA.Original
Sustainability of energy and water for data-center developmentSelangor State Legislative Assembly · published or filed May 18, 2026 · government · curated facility atlasState answer, modified June 16, relaying Air Selangor’s 10 MLD phase-one allocation, dedicated pipeline, and 0.2 MLD recorded actual use as of March 2026. It does not supply a native meter, averaging period, process split, or a compute commissioning record.Original
SoftBank Corp. to construct large-scale AI data center that utilizes Sharp Sakai plantSharp Corporation · published or filed Jun 7, 2024 · company · curated facility atlasSharp’s parallel release on the transfer of part of the Sakai plant land and buildings to SoftBank for an AI data center. It corroborates the site transaction, not the data center’s later status.Original
Google’s hyperscale data centre at Elmina Business Park breaks groundSime Darby Property · published or filed Oct 2, 2024 · company · curated facility atlasDeveloper announcement saying the facility is built to Google specifications, leased to Google, and intended for Google operation upon completion. It does not replace the filed Pearl lease counterparty or prove compute commissioning.Original
Sime Darby Property NEV establishes world’s first RM2.60 billion Sukuk programmeSime Darby Property · published or filed Jul 28, 2026 · company · curated facility atlasThe financing release says a 20-year hyperscale lease came on stream in April 2026 and the wider developments are to be delivered by 2027. Economic lease commencement corroborates the April shell-handover boundary; it is not TNB first energy, tenant fit-out, accelerator acceptance, or production compute.Original
Sime Darby Property’s Q1 year-on-year profit up by 32%Sime Darby Property · published or filed May 26, 2026 · company · curated facility atlasCompany results release confirming completion and handover of the first hyperscale data center and rental commencement. Real-estate income is not proof of server commissioning or live compute.Original
Q1 FY2026 financial results briefingSime Darby Property Berhad · published or filed May 26, 2026 · filing · curated facility atlasInvestor briefing stating that powered shell and core for the first 49-acre hyperscale data center was completed and vacant possession delivered to Pearl on April 1, 2026. It is not an IT commissioning record.Original
Agreement to build and lease a hyperscale data centre at Elmina Business ParkSime Darby Property Berhad via Bursa Malaysia · published or filed May 23, 2024 · filing · curated facility atlasOfficial Bursa Malaysia filing naming SDP EBP Asset I as lessor, Pearl Computing Malaysia as lessee, and their immediate parents. It does not name the ultimate U.S. technology corporation or publish MW.Original
CEO New Year’s MessageSoftBank Corp. · published or filed Jan 1, 2026 · company · curated facility atlasStates that the Tomakomai and Sakai AI data centers “will begin operations sequentially” during 2026. A forward-looking statement on January 1, 2026 shows the Sakai site was not yet operating and gives no phase, MW, or GPU detail.Original
SoftBank Corp. to construct large-scale AI data center that utilizes Sharp Sakai plantSoftBank Corp. · published or filed Jun 7, 2024 · company · curated facility atlasAnnounces a data center on about 440,000 m² of the Sharp Sakai plant with over 150 MW of power capacity initially and over 400 MW expected later, reusing existing power and cooling facilities, with construction targeted for autumn 2024 and full-scale operation in 2025. Targets are not construction or operating records.Original
SoftBank to launch “AI Data Center GPU Cloud” powered by “Infrinia AI Cloud OS” as part of its neocloud business in October 2026SoftBank Corp. · published or filed May 25, 2026 · company · curated facility atlasRefers to NVIDIA GB200 NVL72 deployed in SoftBank’s Japan-based data centers and an October 2026 service launch. It does not name Sakai, so hardware cannot be assigned to the site.Original
SoftBank Group Corp. Offering MemorandumSoftBank Group Corp. · published or filed Apr 15, 2026 · filing · curated facility atlasIssuer offering memorandum describes the 1.2 GW Milam project, a 15-year OpenAI lease, initial OpenAI/SoftBank investments, and anticipated future project financing. Financing expectations are not proof that all capital closed or that a phase entered service.Original
Amazon's Investment Is Building Lasting Opportunity for St. Joseph CountySouth Bend Regional Chamber of Commerce · published or filed Jul 9, 2026 · company · curated facility atlasCompany-authored commentary by an AWS economic-development manager forecasts roughly 18 million gallons of total site water use per year at full buildout. It is not a cooling-only volume or meter record.Original
Central Electric application for Aiken data-center transmissionSouth Carolina PSC · published or filed Feb 15, 2024 · filing · curated facility atlasUp-to-200-MW peak/firm service envelope; not current load.Original
Cordova 100-MW solar PPA application, docket 2025-276-ESouth Carolina PSC · published or filed Oct 15, 2025 · filing · curated facility atlasContract support, not dedicated hourly physical supply.Original
Docket 2024-63-ESouth Carolina PSC · retrieved Aug 15, 2026 · regulator · curated facility atlasLiving docket; order grant 2024-07-23.Original
Order 2026-165 approving Cordova arrangementSouth Carolina PSC · published or filed Mar 26, 2026 · regulator · curated facility atlasApproval does not prove project COD/generation/delivery.Original
Transmission construction status reportSouth Carolina PSC · published or filed Dec 11, 2025 · filing · curated facility atlasSubstantially complete; feeder energization scheduled, not tenant compute.Original
Port Washington Sanitary Sewer Service Area AmendmentSoutheastern Wisconsin Regional Planning Commission via Wisconsin DNR · published or filed Sep 22, 2025 · regulator · curated facility atlasThe 0.50 MGD average-annual sewage assumption applies to the approximately 674-acre service-area addition. It is not a four-building Lighthouse discharge permit or measured flow.Original
Decision 235/2015/1, Tuike operation changeSouthern Finland AVI · published or filed Sep 29, 2015 · regulator · curated facility atlasDocket ESAVI/8564/2014; historical ceilings, not current use.Original
SpaceX EU ProspectusSpace Exploration Technologies Corp. · published or filed Jun 5, 2026 · filing · curated facility atlasBaFin-approved prospectus describing SpaceX acquisition and integration of xAI into its AI segment.Original
New Compute Partnership with AnthropicSpaceXAI · published May 6, 2026 · company · data center primerOriginal
New Compute Partnership with AnthropicSpaceXAI · published or filed May 6, 2026 · company · curated facility atlasReports more than 220,000 H100, H200, and GB200 GPUs at Colossus 1 and a signed Anthropic access agreement; it does not disclose model or workload shares.Original
SpaceXAI’s Leadership in AISpaceXAI Memphis · retrieved Aug 14, 2026 · company · curated facility atlasUndated living page reviewed on the recorded date. It describes 15 permitted generators and more than 240 batteries as backup or grid-stress resources and calls the water-recycling plant under construction; it is not telemetry.Original
A defining moment for Start Campus & PortugalStart Campus · published or filed Oct 30, 2025 · company · curated facility atlasDescribes SIN01 as fully leased with seawater cooling, cites 31 MW for SIN01, a 1.2 GW campus, and a 180 MW SIN02 targeted for 2027. The 31 MW figure conflicts with the 37.5 MW figure on the company site; neither is a metered load.Original
SINES DC — the data centerStart Campus · retrieved Sep 4, 2026 · company · curated facility atlasLiving company page retrieved September 4, 2026. It records an official opening of SIN01 at 37.5 MW, describes a 1.2 GW campus with secured grid access and seawater cooling, and lists certifications. Marketing capacity and grid-access language are not interval load or delivered electricity.Original
Statnett consultation response on the new Skoglund substation and 420 kV Kvandal connectionStatnett via Norwegian Water Resources and Energy Directorate · published or filed Feb 5, 2026 · grid operator · curated facility atlasStatnett schedules the 420 kV works capable of operation in 2029, splits the 230 MW reservation into ordinary and specially restricted portions, and says agreements and a system-operator commissioning decision remain outstanding. This leaves the 2027 Microsoft target unresolved; phased or interim service is a live alternative.Original
Building 2 pollution-permit hearingStatsforvalteren Vestfold og Telemark · published or filed May 13, 2026 · regulator · curated facility atlasApplication/hearing, 46 generators and air-cooled chillers; not final permit.Original
WS Computing building 1 pollution permitStatsforvalteren Vestfold og Telemark · published or filed Aug 25, 2025 · regulator · curated facility atlasSite-specific final permit; not operation.Original
Stellium data-centre FAQsStellium Datacentres · retrieved Aug 14, 2026 · company · curated facility atlasLiving page reviewed on the recorded date. It reports 80 MW of REGO-certified supply at the existing Cobalt campus, 15 MW allocated to Stellium 1, and the balance reserved for future build-out. Certificate matching and existing-campus capacity are not Stargate allocation or physical generation.Original
DATCENTER PARAM — Quilicura regulatory recordSuperintendencia del Medio Ambiente, Chile · retrieved Aug 14, 2026 · regulator · curated facility atlasLiving regulatory record reviewed on the recorded date. It identifies Inversiones y Servicios Dataluna Limitada as the environmental instrument holder for RCA 074/2018; it does not establish model or chip allocation.Original
Sur Energy and OpenAI sign letter of intent for Stargate ArgentinaSur Energy · published or filed Oct 10, 2025 · company · curated facility atlasCompany release records a letter of intent with OpenAI for a data-center project of up to 500 MW and $25 billion at full scale within the RIGI framework. It names no site, province, contract, financing, or date.Original
PHL100 approval and inspection recordSusquehanna River Basin Commission · retrieved Aug 14, 2026 · regulator · curated facility atlasLiving approval record retrieved August 14, 2026. It reports an August 5, 2026 routine inspection with no violation; inspection status is not compute commissioning.Original
PHL100 consumptive-use approval docket 20260301Susquehanna River Basin Commission · published or filed Mar 19, 2026 · regulator · curated facility atlasApproves up to 0.129 MGD maximum 30-day-average consumptive use for evaporative cooling and incidental uses. The ceiling is not measured consumption.Original
Projet de « Campus IA » à Fouju en Seine-et-Marne — question écrite n° 08929Sénat · published or filed Jul 30, 2026 · government · curated facility atlasWritten question of May 28, 2026 and ministerial answer of July 30, 2026. The answer states that 700 MW of electrical power has been contracted with RTE and refers to a public inquiry from April 30 to May 30, 2026 covering environmental authorization, building permits, grid connection, and planning adjustments. A contracted connection and a completed inquiry are not issued permits or energization.Original
TAQA Integrated Report 2025TAQA via Abu Dhabi Securities Exchange · published or filed Mar 13, 2026 · filing · curated facility atlasReports Project Stargate UAE Transmission Scheme Phase 1 infrastructure for 2 GW demand, 14 substations, and a 47-MIGD pumping station with tanks and pipeline for water/cooling. That broader utility scope is not allocated to the 1 GW OpenAI cluster or its first 200 MW phase and is not measured use.Original
APD-CERT registration 184409, Stampede Data CenterTCEQ · published or filed Jun 15, 2026 · regulator · curated facility atlasRowan Stampede LLC; TCEQ did not verify certified rates.Original
Crusoe and Tallgrass Announce AI Data Center in WyomingTallgrass · published or filed Jul 24, 2025 · company · curated facility atlasTallgrass’s copy of the July 24, 2025 announcement describing its energy-infrastructure role for a 1.8 GW campus scalable to 10 GW. It does not establish a power-hub permit, construction, or customer.Original
February 11 2026 Board Meeting MinutesTennessee Valley Authority · published or filed Feb 11, 2026 · government · curated facility atlasItem 26-01-5 authorizes an additional approximately 150 MW firm-power arrangement subject to confidential contractual, financial, and operational requirements; approval is not evidence of energization or draw.Original
TeraWulf Announces Anthropic Lease at Justified Data Campus and Sale of Majority Interest in Abernathy Joint Venture to FluidstackTeraWulf · published or filed Jul 6, 2026 · company · curated facility atlasAnnounces a 20-year Anthropic lease for about 401 MW of critical IT load at the Justified Data Campus in Hawesville, Kentucky with initial service in the second half of 2027 and full capacity by early 2028, and the sale of TeraWulf’s 50.1% interest in the 168 MW Abernathy, Texas joint venture to a Fluidstack-led group, with Fluidstack continuing to lead that project. It does not name an Abernathy tenant, a construction start, or an interconnection.Original
TeraWulf Reports Second Quarter 2026 Results (Exhibit 99.1)TeraWulf via U.S. Securities and Exchange Commission · published or filed Aug 5, 2026 · filing · curated facility atlasDescribes Justified as a campus with access to up to about 480 MW of gross power, an energized on-site substation, existing high-voltage transmission and more than 250 buildable acres, repeats the 401 MW Anthropic lease with up to $33 billion including extensions, and prices the Abernathy interest sale at about $530 million. Gross power access is not a service agreement, permit, or built capacity.Original
Air Quality Standard Permit Registration No. 180842 — ABI-1Texas Commission on Environmental Quality · published or filed Jul 17, 2025 · regulator · curated facility atlasTCEQ review authorizes a 210-generator, 709 MW natural-gas design envelope, with no more than 197 units operating while 13 are in maintenance or shutdown. Air authorization is not evidence that equipment was installed, dispatched, or allocated entirely to critical IT.Original
Pending New Source Review Applications — ABI-1 Permit 182467Texas Commission on Environmental Quality · retrieved Aug 14, 2026 · regulator · curated facility atlasLiving TCEQ pending-application page reviewed on the recorded date. It still lists VoltaGrid ABI-1 applications 182467, PSDTX1692, and GHGPSDTX266; pending status is not permit issuance.Original
Plain Language Summary for ABI-1 Air NSR Permit Application 182467Texas Commission on Environmental Quality · published or filed Dec 18, 2025 · regulator · curated facility atlasThe subsequent case proposes additional internal-combustion generation at ABI-1 for onsite use and a nearby data center at 299 FM 604. The summary does not name Vantage/Frontier or state an approved capacity, and an application is not authorization or operation.Original
Qualified Data Centers — Approved Facilities and ApplicationsTexas Comptroller of Public Accounts · retrieved Aug 14, 2026 · government · curated facility atlasLiving state tax-register page reviewed on the recorded date. It identifies the registered owner, occupant, and operator for ten Vantage TX30x Shackelford facilities and two Milam phases; tax qualification is not commissioning or measured load.Original
TABS Project 2026017746 — Project Freebird Phase 1 DC01Texas Department of Licensing and Regulation · retrieved Aug 14, 2026 · regulator · curated facility atlasLiving accessibility-project registration reviewed on the recorded date. It identifies a four-data-hall phase, owner contact Milam County Data Center LLC, OpenAI tenant contact, and an applicant completion target; it is not a construction permit or commissioning record.Original
TABS Project 2026024068 — Vantage TX301Texas Department of Licensing and Regulation · retrieved Aug 14, 2026 · regulator · curated facility atlasLiving accessibility-project registration reviewed on the recorded date. It records a June 29, 2026 registration, $950 million estimated cost, 344,796 square feet, and applicant schedule for TX301; it is not a building permit, completion certificate, or energization record.Original
House Committee on State Affairs hearing — Data Centers Interim ChargeTexas House of Representatives · published or filed Apr 9, 2026 · government · curated facility atlasAt 02:56:14–02:56:36, Lancium CEO Michael McNamara describes three buildings as running full out and reports an operator-stated March 2026 campus water-use rate of 20 gallons per minute. No underlying meter record or source-class split is supplied.Original
Texas Senate Bill 6 — enrolled textTexas Legislature · effective Jun 20, 2025 · government · data center primerOriginal
Thailand BOI approves USD 2 billion in data center and PCB factory investmentThailand Board of Investment (via PR Newswire APAC) · published or filed Nov 1, 2024 · government · curated facility atlasBOI release recording approval of a 32.8 billion baht investment by Quartz Computing Co., Ltd., an Alphabet subsidiary, for a hyperscale data center in Chonburi. Investment promotion is not a construction permit, energization, or operation.Original
Georgia Power deal to serve $20B OpenAI data center under regulators’ microscopeThe Atlanta Journal-Constitution · published or filed Aug 17, 2026 · journalism · curated facility atlasReports the staff review window opened July 15, 2026 with an extension to August 26, staff concerns before the extension, an industrial-park site of hundreds of acres about 30 minutes from Savannah, and roughly one-third curtailability. It does not describe construction status or a water source.Original
Microsoft’s newest AI ‘superfactory’ opens at sprawling Fayetteville campusThe Atlanta Journal-Constitution · published or filed Nov 21, 2025 · journalism · curated facility atlasReports that Microsoft confirmed the facility is in Fayetteville, that open-records material shows the only site permitted for data-center occupancy there is within a 615-acre QTS-developed campus, and that the facility began operating in October and spans more than 1 million square feet. It does not establish MW, utility service, or which buildings Microsoft occupies.Original
YTL Power completes first Nvidia-powered AI data centre in Johor, YTL AI Cloud now operationalThe Edge Malaysia · published or filed Oct 31, 2025 · journalism · curated facility atlasReports the completion on a 1,640-acre site, the 600 MW park, a 500 MW solar plant, and GB200 NVL72 hardware. It does not report a GPU count or the AI facility’s capacity.Original
OpenAI’s apparent failure to visit key site raises questions over UK investmentThe Guardian · published or filed Jul 4, 2026 · journalism · curated facility atlasReports from freedom-of-information responses that no local-authority meetings with OpenAI or Nscale were recorded and quotes OpenAI saying the project remained paused pending energy-cost and regulatory conditions.Original
SK, AWS break ground on Korea’s largest AI center in UlsanThe Korea Herald · published or filed Aug 29, 2025 · journalism · curated facility atlasReports an August 29, 2025 groundbreaking ceremony with SK, SK ecoplant, AWS Korea, and the Ulsan mayor, and rack densities of 20–40 kW with hybrid cooling designed for 40–100 kW per rack. A reported ceremony is not a permit, building completion, or energization record.Original
At Amazon’s Biggest Data Center, Everything Is Supersized for A.I.The New York Times · published or filed Jun 24, 2025 · journalism · curated facility atlasReports that Rainier extends to Mississippi and possibly North Carolina and Pennsylvania. Amazon does not publicly confirm those Rainier geographies, and the article does not identify exact campuses or allocate chips among them.Original
Google meets the neighbors and gets both barrels over its new UK datacenterThe Register · published or filed Jul 24, 2026 · journalism · curated facility atlasReports a community meeting at which Google described closed-loop chilled-water cooling with roughly 60 cubic metres per month of domestic water, an expected 77 MW at full build-out that the site is “nowhere near”, planning permission dated November 30, 2023, and resident noise and lighting complaints. Figures stated at a meeting are not metered records.Original
Malaysia powers up sovereign AI with Nvidia-backed data centreThe Star · published or filed Oct 31, 2025 · journalism · curated facility atlasReports the Prime Minister’s statement on the completed Kulai facility and the ILMU language model launched in August 2025. It corroborates the completion announcement without adding capacity or load figures.Original
Malaysia: TotalEnergies signs renewable power agreement with Google to supply data centersTotalEnergies · published or filed Dec 16, 2025 · company · curated facility atlasAnnounces a 21-year PPA totaling 1 TWh, described as equivalent to 20 MW, from a planned Kedah solar project for Google operations in Malaysia. It is not Elmina site capacity or physical hourly delivery.Original
Tuike Finland Oy Hamina data center environmental impact assessment reportTuike Finland Oy via Finland environmental administration · published or filed Mar 20, 2024 · filing · curated facility atlasPrimary EIA report for the operating campus and possible expansion. It documents 110 kV grid topology, different seawater cooling modes, and permit ceilings; none is a facility-load or water-consumption measurement.Original
Best Management Practice 10: Cooling Tower ManagementU.S. Department of Energy · accessed Aug 13, 2026 · government · data center primerOriginal
Best Practices Guide for Energy-Efficient Data Center DesignU.S. Department of Energy · published Jul 26, 2024 · government · data center primerOriginal
Cooling Water Efficiency Opportunities for Federal Data CentersU.S. Department of Energy · published Jan 9, 2019 · government · data center primerOriginal
Side Stream Filtration for Cooling TowersU.S. Department of Energy · accessed Aug 13, 2026 · government · data center primerOriginal
Justice Department Files to Intervene and Dismiss Lawsuit that Would Hamper America’s AI Innovation and SecurityU.S. Department of Justice · published or filed Jun 16, 2026 · government · curated facility atlasRecords the federal government’s motion and Mississippi’s position in case 3:26-cv-00074-DMB-JMV; it does not resolve the Clean Air Act dispute or quantify current turbine dispatch.Original
Clean Air Act Resources for Data CentersU.S. Environmental Protection Agency · updated May 14, 2026 · government · data center primerOriginal
NPDES Permit BasicsU.S. Environmental Protection Agency · updated Jul 22, 2026 · government · data center primerPoint-source discharge framework; it does not itself grant water withdrawal, sewer-service, or land-use approval.Original
Support Documents for Final Rule for Existing Electric Generating Plants and Factories – 2014U.S. Environmental Protection Agency · updated Mar 31, 2026 · government · data center primerIntake/ecology background. The cited 2014 rule covers qualifying existing power plants and factories; it does not automatically apply to every data center.Original
Alphabet Inc. Exhibit 21.01 — Subsidiaries of the RegistrantU.S. Securities and Exchange Commission · published or filed Feb 5, 2026 · filing · curated facility atlasOriginal
Amazon.com, Inc. Exhibit 21.1 — List of Significant SubsidiariesU.S. Securities and Exchange Commission · published or filed Feb 6, 2026 · filing · curated facility atlasOriginal
Talen Energy Corporation Q1 2026 Form 10-QU.S. Securities and Exchange Commission · published or filed May 7, 2026 · filing · curated facility atlasReports that the revised front-of-meter transition occurred in April 2026; contract transition is not building or compute commissioning.Original
Talen Energy Corporation Q2 2025 Form 10-QU.S. Securities and Exchange Commission · published or filed Aug 7, 2025 · filing · curated facility atlasDescribes the AWS asset sale and revised front-of-meter PPA up to 1,920 MW through 2042, with Talen retail supply and PPL transmission/delivery. The ceiling is not current draw or IT capacity.Original
North East AI Growth Zone taskforce launched to accelerate jobs, skills and growthUK Department for Science, Innovation and Technology · published or filed Sep 24, 2025 · government · curated facility atlasDescribes existing ready-to-use data centres and a pathway to around 500 MVA at Cobalt Park, while repeating the program-wide 8,000/31,000 GPU figures. It does not establish a Cobalt Park allocation, power contract, or construction award for Stargate UK.Original
Written question 126560: OpenAI Stargate UK investmentUK Parliament · published or filed Apr 21, 2026 · government · curated facility atlasThe government response acknowledges OpenAI’s pause and says Cobalt Park was discussing alternative offtake customers. It does not identify a resumed OpenAI agreement.Original
Written question 15565: Artificial Intelligence — InvestmentUK Parliament / Department for Science, Innovation and Technology · published or filed Jul 15, 2026 · government · curated facility atlasThe minister characterizes OpenAI’s program-wide Stargate UK decision as a pause during a global infrastructure recalibration, not a UK-specific termination. Neither question nor answer names Cobalt Park; site allocation remains unproved.Original
Frontier data center campusVantage Data Centers · accessed Aug 13, 2026 · company · data center primerOriginal
Frontier — Shackelford County, TexasVantage Data Centers · retrieved Aug 14, 2026 · company · curated facility atlasLiving campus page reviewed on the recorded date. It labels 1.4 GW as planned critical IT load and describes a combined air/liquid, closed-loop chilled-water design; it supplies no operating meter record.Original
Port Washington (Lighthouse) Data Center CampusVantage Data Centers · retrieved Aug 14, 2026 · company · curated facility atlasLiving page reviewed on the recorded date. Gives 902 MW of planned critical IT load and a GPU-ready closed-loop cooling design; it does not disclose site-bound accelerator orders.Original
Port Washington’s Historic 1860 Light Station Restoration Receives $60,000 Community Investment from Vantage Data Centers, Oracle and OpenAIVantage Data Centers · published or filed Aug 11, 2026 · company · curated facility atlasNames the Port Washington development as Vantage’s Lighthouse data center campus and records a joint Vantage–Oracle–OpenAI community contribution. It states no construction progress, energization, or capacity.Original
Vantage Data Centers Unveils Plans for Frontier, a $25B Mega-Campus in TexasVantage Data Centers · published or filed Aug 19, 2025 · company · curated facility atlasCompany announcement says construction had begun, describes ten planned buildings and 1.4 GW of GPU-compute capacity, and targets the first building for the second half of 2026. These are construction and design claims, not proof of an energized compute phase.Original
Lighthouse Campus Water and Wastewater Demand DataVantage Data Centers via City of Port Washington public-record production · published or filed Aug 22, 2025 · filing · curated facility atlasPrimary Vantage design memo contained in the City’s October 23, 2025 records response. For WI11–WI14 plus support buildings it estimates 18,840 gallons per day average domestic water, 23,737 gallons peak day, and 13,080 gallons per day wastewater. These are design demands, not permits or readings.Original
Lordstown Board of Public Affairs Minutes — October 7, 2025Village of Lordstown · published or filed Oct 7, 2025 · government · curated facility atlasMinutes record revised factory/expansion peak-flow planning of 143 gallons per minute and state that actual project demand was still awaited. The scope is broader than the proof-of-concept and is not measured consumption.Original
Lordstown Planning Commission Minutes — September 16, 2025Village of Lordstown · published or filed Sep 16, 2025 · government · curated facility atlasApproved site-plan minutes record the applicant representative saying the expansion was for engineering/design and customer demonstration, would not be used as a working AI center/data center, and was not a production-scale facility.Original
Lordstown Village Council Meeting — April 6, 2026Village of Lordstown · published or filed Apr 6, 2026 · government · curated facility atlasA Foxconn representative distinguishes a much larger SoftBank Ohio project from the Lordstown Foxconn work and says the larger project does not involve the Lordstown facility.Original
Lordstown Village Council Transcript — October 6, 2025Village of Lordstown · published or filed Oct 6, 2025 · government · curated facility atlasMunicipal transcript reproduces SoftBank correspondence narrowing Lordstown to a proof-of-concept using existing power and space, a very small share of the combined announced IT load, and closed-loop cooling; it explicitly says no large-scale data center was planned there.Original
MKE03/04 assured delineator report and utility projectionsVillage of Mount Pleasant project record / WPR mirror · published or filed Nov 6, 2023 · filing · curated facility atlasProject design record for the first MKE03/04 facility. The at-least-752-MW substation design figure is a design ceiling, not current draw, IT capacity, approved service, or phase allocation.Original
Virginia Code § 15.2-2209.5Virginia General Assembly · effective Jul 1, 2026 · government · data center primerOriginal
Data Centers in VirginiaVirginia Joint Legislative Audit and Review Commission · published Dec 9, 2024 · government · data center primerVirginia-specific audit using multiple data sets. Its resident-reported noise and modeled future-cost findings are not measured national operating rates.Original
City of Vineland, N.J. issues stop-work order to parts of data centerWHYY · published or filed Aug 14, 2026 · journalism · curated facility atlasReports two stop-work orders for LNG-tank and Bloom fuel-cell placement done without permits at the 300 MW DataOne/Nebius project, whose first phase was already approved and under construction, with DataOne saying the pause would not affect its delivery timeline. It establishes construction and a permitting dispute, not energization.Original
Vineland planning board approves 2nd phase of 300-megawatt data center planWHYY · published or filed Aug 18, 2026 · journalism · curated facility atlasReports an 8–1 planning-board approval of phase 2, a proposed 1.5-million-gallon LNG tank and fuel-cell plant still awaiting approval, more than 400 cooling fans with misting, and a projected 8 million gallons per year of city water. Planning approval is not a building permit, power-plant permit, or measured use.Original
Records raise questions about Georgia’s largest data center and its water useWRDW / Atlanta News First · published or filed Jul 13, 2026 · journalism · curated facility atlasReports county billing records showing about 109 million gallons across 13 lines since a February 2024 meter activation at the 600-acre QTS Fayetteville site, construction expected through 2030, and a projected operational use of 9,000–12,000 gallons monthly. Construction-period totals are not operating consumption, and the report does not name Microsoft.Original
Amazon data-center overviewWarren County · retrieved Aug 15, 2026 · government · curated facility atlasLiving county project page; no inferred parcel unless stated.Original
Data Center OverviewWarren County · retrieved Aug 15, 2026 · government · curated facility atlasFour-page undated county flyer reviewed on the retrieval date; no publication day is inferred.Original
Saline data center consent judgmentWashtenaw County Circuit Court via Saline Township · published or filed Dec 10, 2025 · filing · curated facility atlasNames RD Michigan Property Owner I LLC as developer and limits the project from high-water-use evaporative cooling.Original
Socrates Power Solution FacilitiesWilliams · retrieved Aug 14, 2026 · company · curated facility atlasLiving project page retrieved August 14, 2026. It describes two 200-MW facilities and quarterly targets, not independent commissioning proof.Original
Microsoft Mount Pleasant air-permit trackerWisconsin Department of Natural Resources · retrieved Aug 14, 2026 · regulator · curated facility atlasLiving facility-permit tracker retrieved August 14, 2026; permit activity is not evidence of generator count, current load, or compute commissioning.Original
Microsoft Mount Pleasant proposed air-permit modification noticeWisconsin Department of Natural Resources · retrieved Aug 14, 2026 · regulator · curated facility atlasCovers emergency generators and fire pumps but does not supply a dependable public generator count or operating megawatts.Original
Port Washington Data Center ProposalWisconsin Department of Natural Resources · retrieved Aug 14, 2026 · regulator · curated facility atlasLiving project hub reviewed on the recorded date. It describes the 672-acre campus as under construction and lists stormwater permit WI-S067831-6 and air permits 25-MIN-094/24618528A-F01 for 45 diesel emergency generators. Those infrastructure permits do not establish accelerator orders, operational water, or live compute.Original
Port Washington Data Center Proposal Environmental Analysis SummaryWisconsin Department of Natural Resources · published or filed Dec 9, 2025 · regulator · curated facility atlasDescribes four buildings with nearly 1 GW of critical computing capacity, Project 1 completion in Q3 2028, Project 2 completion in Q4 2028, no normal process-cooling discharge, and a 13,080-gallon-per-day sanitary-sewage design estimate. These are project plans, not operating measurements or permit limits.Original
Supplemental Information — Port Washington Data Center Proposal Environmental Analysis SummaryWisconsin Department of Natural Resources · published or filed Jun 12, 2026 · regulator · curated facility atlasSeparates 1.3 GW of planned facility electrical demand from a 1.85 GW contracted share of MISO-accredited load-serving capacity; the latter is not generation delivered to the campus.Original
Laramie County approves construction of what could become the largest data center in USWyoFile · published or filed Jan 20, 2026 · journalism · curated facility atlasCorroborates the January 6, 2026 approvals at Switchgrass Industrial Park eight miles south of Cheyenne: 1.8 GW data center scalable to 10 GW, 2.7 GW of gas turbines, deep Lance Formation industrial-water wells, early-2026 construction start intent, and about 400 permanent jobs. Reported intent is not mobilization.Original
Malaysia accelerates sovereign AI ambition — NVIDIA and YTL brief Prime Minister Anwar Ibrahim at APEC SummitYTL Power International · published or filed Oct 31, 2025 · company · curated facility atlasCompany release recording completion of the AI data centre facility at Kulai with liquid-cooled NVL72 Grace Blackwell (GB200) GPUs inside the 600 MW park and stating that YTL AI Cloud is now operational. It gives no facility MW, GPU count, or metered load.Original
YTL to advance AI development in Malaysia in collaboration with NVIDIAYTL Power International · published or filed Dec 8, 2023 · company · curated facility atlasDescribes the YTL Green Data Center Park in Kulai as a 500 MW facility to be powered by an equivalent amount of on-site solar, plans for NVIDIA H100 GPUs, and YTL Communications owning and managing the AI infrastructure. Park-level and solar figures are not the AI facility’s load or hourly supply.Original
Colossus: The World's Largest AI SupercomputerxAI · retrieved Aug 14, 2026 · company · curated facility atlasUndated living page, reviewed on the publication date recorded here.Original
Grok 3 Beta — The Age of Reasoning AgentsxAI · published or filed Feb 19, 2025 · company · curated facility atlasExplicitly says Grok 3 was trained on Colossus. It names mini and Think variants but does not separately attribute each variant to the Memphis facility.Original
Grok 4xAI · published or filed Jul 9, 2025 · company · curated facility atlasSays the 200,000-GPU Colossus cluster ran Grok 4 reinforcement-learning training at pretraining scale; it does not separately locate Grok 4 Heavy training.Original
xAI joins SpaceXxAI · published or filed Feb 2, 2026 · company · curated facility atlasOriginal
The source ledger and evidence bundle are downloadable because this page should create reporting, not merely summarize it. The stable method is to keep physical location, legal organization, commercial role, facility status, measurement boundary, date, and source separate until a document actually connects them.
Sources worth opening
These reading notes were checked on September 17, 2026. The interactive source ledgers retain their separately dated records.